5-day weather forecast Mbandaka Nov 18, 2026

28°23° · Patchy rain possible

Weather forecast Mbandaka Wednesday Nov 18, 2026: patchy rain possible, temperature from 23 °C to 28 °C.

Precipitation probability 86%. Wind up to 2.31 m/s (gusts 5.53 m/s). Air humidity 71–97%, atmospheric pressure 756–760 mm Hg, UV index up to 7.5.

Sunrise 05:28
Sunset 17:35
Waxing Gibbous73% illuminated
Moonrise 12:46 · Moonset 00:25
Chart
Table

Forecast from 23 °C to 28 °C and precipitation

Temperature & Precipitation
Time00:0001:0002:0003:0004:0005:0006:0007:0008:0009:0010:0011:0012:0013:0014:0015:0016:0017:0018:0019:0020:0021:0022:0023:00
Temperature (°C)242423232323232324252728282827272726252524242323
Precipitation (mm/hr)0.130.220.882.22.571.660.990.340.260.070.010.070.130.190.140.10.050.040.0200000

Cloud cover and precipitation probability

Cloud cover & Rain chance
Time00:0001:0002:0003:0004:0005:0006:0007:0008:0009:0010:0011:0012:0013:0014:0015:0016:0017:0018:0019:0020:0021:0022:0023:00
Cloud cover (%)989910010010010010010098969492898581655481594746666089
Rain chance (%)504974848681775756352423272728231926221919242335

Wind speed and direction

Wind & Wind gust
Time00:0001:0002:0003:0004:0005:0006:0007:0008:0009:0010:0011:0012:0013:0014:0015:0016:0017:0018:0019:0020:0021:0022:0023:00
Wind (m/s)0.690.50.50.310.390.811.311.811.8922.311.891.611.691.111.191.390.890.390.190.611.111.691.69
Wind gust (m/s)1.311.421.753.174.614.424.394.584.534.895.534.724.694.564.224.364.333.142.141.51.892.393.283.67
Wind direction (°)SSW 209°SSW 196°WSW 241°SW 220°WSW 253°SSW 211°SSW 197°S 186°S 190°SSW 192°S 189°S 178°SSE 160°SSE 168°SSW 193°SW 217°WSW 244°WSW 250°WSW 253°S 172°S 171°S 170°SSE 163°SSE 159°

Air humidity

Humidity
Time00:0001:0002:0003:0004:0005:0006:0007:0008:0009:0010:0011:0012:0013:0014:0015:0016:0017:0018:0019:0020:0021:0022:0023:00
Humidity (%)949596979797979793898172727176788185899192939495

Atmospheric pressure

Pressure
Time00:0001:0002:0003:0004:0005:0006:0007:0008:0009:0010:0011:0012:0013:0014:0015:0016:0017:0018:0019:0020:0021:0022:0023:00
Pressure (mm Hg)758758758758758759760760760760760759758758757756756756757758758759759759

Ultraviolet index

UV Index
Time00:0001:0002:0003:0004:0005:0006:0007:0008:0009:0010:0011:0012:0013:0014:0015:0016:0017:0018:0019:0020:0021:0022:0023:00
UV Index00000000.41.73.13.84.67.27.55.83.21.40.3000000

Air quality & pollen

Air quality
Time00:0001:0002:0003:0004:0005:0006:0007:0008:0009:0010:0011:0012:0013:0014:0015:0016:0017:0018:0019:0020:0021:0022:0023:00
PM2.5 (µg/m³)6.86.255.25.365.74.75.25.85.65.97.599.49.59.69.810.811.79.89.39.69.7
PM10 (µg/m³)7.16.55.25.55.66.464.95.56.15.96.27.99.71010.210.210.311.312.210.41010.410.5
Ozone (O₃) (µg/m³)404241373536383939383942475051514943363133384139
NO₂ (µg/m³)0.10.10.10.20.20.20.20.20.20.10.10.10.10.10.10.10.10.30.50.60.50.30.20.2
SO₂ (µg/m³)0.20.20.20.20.20.20.20.20.20.20.20.20.20.20.20.20.20.20.30.30.30.20.20.2
CO (µg/m³)171174181190195192186181180180180179178178181186189191192191187182177174

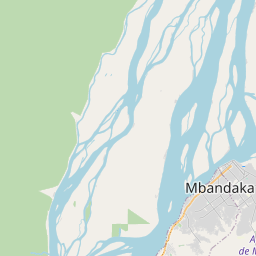
Mbandaka on the map

Data Sources & Methodology

Our weather forecasts are powered by a professional weather data provider that aggregates data from national weather services, satellite observations, radar networks, and over 80,000 weather stations worldwide. Forecast data is updated multiple times daily. We convert raw data into clear summaries — wind speed in m/s, pressure in mmHg — so you can plan your day with confidence.