5-day weather forecast Mbandaka Nov 17, 2026

27°24° · Light rain shower

Weather forecast Mbandaka tomorrow Nov 17, 2026: light rain shower, temperature from 24 °C to 27 °C.

Precipitation probability 87%. Wind up to 1.61 m/s (gusts 4.25 m/s). Air humidity 78–98%, atmospheric pressure 755–760 mm Hg, UV index up to 5.1.

Sunrise 05:28
Sunset 17:35
First Quarter63% illuminated
Moonrise 12:06 · Moonset does not set today
Chart
Table

Forecast from 24 °C to 27 °C and precipitation

Temperature & Precipitation
Time00:0001:0002:0003:0004:0005:0006:0007:0008:0009:0010:0011:0012:0013:0014:0015:0016:0017:0018:0019:0020:0021:0022:0023:00
Temperature (°C)242424242424242424252626272727272727262525242424
Precipitation (mm/hr)0.190.210.91.832.71.911.20.220.771.351.871.320.770.220.150.370.020.020.010000.010.07

Cloud cover and precipitation probability

Cloud cover & Rain chance
Time00:0001:0002:0003:0004:0005:0006:0007:0008:0009:0010:0011:0012:0013:0014:0015:0016:0017:0018:0019:0020:0021:0022:0023:00
Cloud cover (%)8984899410099999999989898989896736067959786889697
Rain chance (%)464673818782785070777873633939431619272826283138

Wind speed and direction

Wind & Wind gust
Time00:0001:0002:0003:0004:0005:0006:0007:0008:0009:0010:0011:0012:0013:0014:0015:0016:0017:0018:0019:0020:0021:0022:0023:00
Wind (m/s)0.811.391.51.311.611.310.8911.191.191.111.191.311.391.51.51.311.111110.810.610.81
Wind gust (m/s)3.193.063.753.473.923.472.692.423.223.814.2543.783.423.334.173.863.2821.641.51.311.031.28
Wind direction (°)SW 219°SW 231°SW 227°SSW 200°SSW 193°S 180°S 174°S 190°SSW 197°SSW 212°SW 214°SSW 213°SW 216°SW 215°SW 228°SW 227°SW 234°WSW 237°SW 235°SW 233°SW 236°SW 236°SSW 198°SSW 204°

Air humidity

Humidity
Time00:0001:0002:0003:0004:0005:0006:0007:0008:0009:0010:0011:0012:0013:0014:0015:0016:0017:0018:0019:0020:0021:0022:0023:00
Humidity (%)979898989898979794918887848179827881868990929494

Atmospheric pressure

Pressure
Time00:0001:0002:0003:0004:0005:0006:0007:0008:0009:0010:0011:0012:0013:0014:0015:0016:0017:0018:0019:0020:0021:0022:0023:00
Pressure (mm Hg)758758758758758758759759760760760759758757756756755756756757758758759759

Ultraviolet index

UV Index
Time00:0001:0002:0003:0004:0005:0006:0007:0008:0009:0010:0011:0012:0013:0014:0015:0016:0017:0018:0019:0020:0021:0022:0023:00
UV Index00000000.41.51.81.62.83.25.131.60.80.3000000

Air quality & pollen

Air quality
Time00:0001:0002:0003:0004:0005:0006:0007:0008:0009:0010:0011:0012:0013:0014:0015:0016:0017:0018:0019:0020:0021:0022:0023:00
PM2.5 (µg/m³)118.38.68.48.78.99.39.811.212.713.413.112.612.211.811.611.211.612.813.211.99.77.47.7
PM10 (µg/m³)11.89.19.59.39.69.810.311.112.814.615.314.814.113.513.112.712.212.413.513.912.410.27.88.1
Ozone (O₃) (µg/m³)343534323029293032353737373636363532272526293236
NO₂ (µg/m³)0.20.20.20.20.20.20.20.20.20.10.10.10.10.10.10.10.10.30.50.60.50.30.20.1
SO₂ (µg/m³)0.50.50.50.40.40.40.50.50.50.40.40.40.40.40.40.30.30.30.40.40.40.30.30.3
CO (µg/m³)172169169170171172173174173172171171170172177183187187186183179175172171

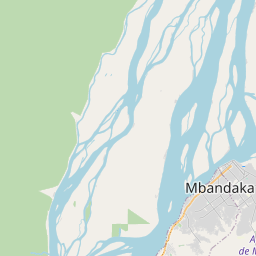
Mbandaka on the map

Data Sources & Methodology

Our weather forecasts are powered by a professional weather data provider that aggregates data from national weather services, satellite observations, radar networks, and over 80,000 weather stations worldwide. Forecast data is updated multiple times daily. We convert raw data into clear summaries — wind speed in m/s, pressure in mmHg — so you can plan your day with confidence.