5-day weather forecast Kanunka Nov 21, 2026

30°17° · Patchy rain possible

Weather forecast Kanunka Saturday Nov 21, 2026: patchy rain possible, temperature from 17 °C to 30 °C.

Precipitation probability 77%. Wind up to 2.31 m/s (gusts 8.42 m/s). Air humidity 45–95%, atmospheric pressure 759–762 mm Hg, UV index up to 13.2.

Sunrise 05:22
Sunset 18:08
Waxing Gibbous95% illuminated
Moonrise 15:13 · Moonset 02:31
Chart
Table

Forecast from 17 °C to 30 °C and precipitation

Temperature & Precipitation
Time00:0001:0002:0003:0004:0005:0006:0007:0008:0009:0010:0011:0012:0013:0014:0015:0016:0017:0018:0019:0020:0021:0022:0023:00
Temperature (°C)181817171717192225272930272321212120191919181818
Precipitation (mm/hr)0.020.03000.02000.010.010.060.10.410.51.381.690.640.620.630.371.180000

Cloud cover and precipitation probability

Cloud cover & Rain chance
Time00:0001:0002:0003:0004:0005:0006:0007:0008:0009:0010:0011:0012:0013:0014:0015:0016:0017:0018:0019:0020:0021:0022:0023:00
Cloud cover (%)8887737481535760616280999999989999100989464716041
Rain chance (%)283025242819171410171736416877686563587523252325

Wind speed and direction

Wind & Wind gust
Time00:0001:0002:0003:0004:0005:0006:0007:0008:0009:0010:0011:0012:0013:0014:0015:0016:0017:0018:0019:0020:0021:0022:0023:00
Wind (m/s)1.111.110.8111.191.391.391.51.691.891.811.892.311.111.190.811.111.891.691.311.310.891.191.5
Wind gust (m/s)2.862.311.531.641.942.142.673.674.674.724.895.145.866.727.948.426.036.54.754.723.112.782.673.25
Wind direction (°)ESE 103°ENE 70°ENE 71°ENE 74°ENE 65°ENE 60°ENE 71°E 79°E 82°E 79°ENE 76°E 90°E 94°NE 42°N 355°NNE 31°SE 136°SE 137°ESE 105°ESE 110°E 98°ENE 77°ENE 61°ENE 58°

Air humidity

Humidity
Time00:0001:0002:0003:0004:0005:0006:0007:0008:0009:0010:0011:0012:0013:0014:0015:0016:0017:0018:0019:0020:0021:0022:0023:00
Humidity (%)909193919190847564565045597890878388889293939395

Atmospheric pressure

Pressure
Time00:0001:0002:0003:0004:0005:0006:0007:0008:0009:0010:0011:0012:0013:0014:0015:0016:0017:0018:0019:0020:0021:0022:0023:00
Pressure (mm Hg)762761761761761761762762762762761761760759760759760760760761761761761762

Ultraviolet index

UV Index
Time00:0001:0002:0003:0004:0005:0006:0007:0008:0009:0010:0011:0012:0013:0014:0015:0016:0017:0018:0019:0020:0021:0022:0023:00
UV Index00000000.936.410.213.27.56.58.12.210.4000000

Air quality & pollen

Air quality
Time00:0001:0002:0003:0004:0005:0006:0007:0008:0009:0010:0011:0012:0013:0014:0015:0016:0017:0018:0019:0020:0021:0022:0023:00
PM2.5 (µg/m³)2.52.52.52.52.62.732.51.91.81.81.71.61.51.61.71.922.52.82.932.82.7
PM10 (µg/m³)2.52.52.62.62.62.732.52.12.121.91.71.61.71.81.92.12.52.9332.82.7
Ozone (O₃) (µg/m³)363331292727313742444546464645444442393532323435
NO₂ (µg/m³)1.51.822.42.932.31.20.300.10.10.10.10.20.30.30.50.81.31.61.71.61.6
SO₂ (µg/m³)0.30.30.30.30.30.30.30.30.30.30.30.30.30.20.20.20.30.30.30.40.40.40.30.3
CO (µg/m³)127129130127124121121123123121117114113112113116121125129133134132128124

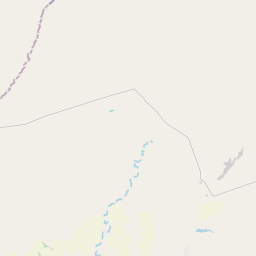
Kanunka on the map

Data Sources & Methodology

Our weather forecasts are powered by a professional weather data provider that aggregates data from national weather services, satellite observations, radar networks, and over 80,000 weather stations worldwide. Forecast data is updated multiple times daily. We convert raw data into clear summaries — wind speed in m/s, pressure in mmHg — so you can plan your day with confidence.