5-day weather forecast Fort Liard Nov 20, 2026

-7°-11° · Mist

Weather forecast Fort Liard tomorrow Nov 20, 2026: mist, temperature from -11 °C to -7 °C.

Precipitation probability 38%. Wind up to 1.89 m/s (gusts 4.14 m/s). Air humidity 83–96%, atmospheric pressure 766–767 mm Hg, UV index up to 0.2.

Sunrise 10:26
Sunset 17:32
Waxing Gibbous89% illuminated
Moonrise 15:55 · Moonset 05:05
Chart
Table

Forecast from -11 °C to -7 °C and precipitation

Temperature & Precipitation
Time00:0001:0002:0003:0004:0005:0006:0007:0008:0009:0010:0011:0012:0013:0014:0015:0016:0017:0018:0019:0020:0021:0022:0023:00
Temperature (°C)-11-11-11-11-11-11-11-11-11-11-10-10-9-8-7-7-7-8-10-10-10-10-10-9
Precipitation (mm/hr)0.010.010.010.010.010.010.010.010.010.010.010.010.010.010000000000

Cloud cover and precipitation probability

Cloud cover & Rain chance
Time00:0001:0002:0003:0004:0005:0006:0007:0008:0009:0010:0011:0012:0013:0014:0015:0016:0017:0018:0019:0020:0021:0022:0023:00
Cloud cover (%)939494959594949495959392898784815950617179878989
Rain chance (%)383838383838383832323231292724221920232527292929

Wind speed and direction

Wind & Wind gust
Time00:0001:0002:0003:0004:0005:0006:0007:0008:0009:0010:0011:0012:0013:0014:0015:0016:0017:0018:0019:0020:0021:0022:0023:00
Wind (m/s)0.310.390.50.50.50.50.50.50.50.610.610.810.8111.311.811.611.691.611.691.691.811.891.89
Wind gust (m/s)0.670.831.031.111.141.141.221.221.141.111.361.612.032.643.254.143.753.363.223.363.473.583.673.83
Wind direction (°)E 80°E 83°E 86°E 87°E 97°ESE 103°ESE 109°ESE 117°SE 130°SE 133°SE 144°SSE 154°S 169°S 190°SSW 203°SSW 208°SSW 202°SSW 204°SSW 200°SSW 199°SSW 204°SSW 204°SSW 203°SSW 202°

Air humidity

Humidity
Time00:0001:0002:0003:0004:0005:0006:0007:0008:0009:0010:0011:0012:0013:0014:0015:0016:0017:0018:0019:0020:0021:0022:0023:00
Humidity (%)969595949494949494949493918885838691949493939392

Atmospheric pressure

Pressure
Time00:0001:0002:0003:0004:0005:0006:0007:0008:0009:0010:0011:0012:0013:0014:0015:0016:0017:0018:0019:0020:0021:0022:0023:00
Pressure (mm Hg)767767767767767767767767767767767767767767767767766766766766766766766766

Ultraviolet index

UV Index
Time00:0001:0002:0003:0004:0005:0006:0007:0008:0009:0010:0011:0012:0013:0014:0015:0016:0017:0018:0019:0020:0021:0022:0023:00
UV Index0000000000000.20.20.20.200000000

Air quality & pollen

Air quality
Time00:0001:0002:0003:0004:0005:0006:0007:0008:0009:0010:0011:0012:0013:0014:0015:0016:0017:0018:0019:0020:0021:0022:0023:00
PM2.5 (µg/m³)0.90.90.80.80.91.11.21.31.31.210.90.60.30.20.10.10.10.10.10.10.10.10.1
PM10 (µg/m³)110.90.91.11.21.31.41.41.31.110.70.30.20.10.10.10.10.10.10.10.10.1
Ozone (O₃) (µg/m³)626363646465656565666769727679797876757372717170
NO₂ (µg/m³)3.22.92.62.31.91.71.61.51.51.51.41.310.70.40.30.30.30.30.30.30.30.30.3
SO₂ (µg/m³)0.10.10.10.10.10.10.10.10.10.10.10.10.10.10.10.10.10.10.10.10.10.100
CO (µg/m³)106106105104103103103103104105106107107108108109109110110111111111110110

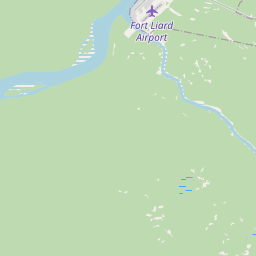
Fort Liard on the map

Data Sources & Methodology

Our weather forecasts are powered by a professional weather data provider that aggregates data from national weather services, satellite observations, radar networks, and over 80,000 weather stations worldwide. Forecast data is updated multiple times daily. We convert raw data into clear summaries — wind speed in m/s, pressure in mmHg — so you can plan your day with confidence.