5-day weather forecast Fort Liard Nov 21, 2026

-7°-13° · Cloudy

Weather forecast Fort Liard Saturday Nov 21, 2026: cloudy, temperature from -13 °C to -7 °C.

Precipitation probability 32%. Wind up to 2 m/s (gusts 4.17 m/s). Air humidity 82–94%, atmospheric pressure 764–765 mm Hg, UV index up to 0.2.

Sunrise 10:28
Sunset 17:31
Waxing Gibbous95% illuminated
Moonrise 15:55 · Moonset 06:34
Chart
Table

Forecast from -13 °C to -7 °C and precipitation

Temperature & Precipitation
Time00:0001:0002:0003:0004:0005:0006:0007:0008:0009:0010:0011:0012:0013:0014:0015:0016:0017:0018:0019:0020:0021:0022:0023:00
Temperature (°C)-9-9-9-9-9-10-11-11-11-12-12-12-10-9-8-7-8-9-10-11-11-12-12-13
Precipitation (mm/hr)000000000000000000000000

Cloud cover and precipitation probability

Cloud cover & Rain chance
Time00:0001:0002:0003:0004:0005:0006:0007:0008:0009:0010:0011:0012:0013:0014:0015:0016:0017:0018:0019:0020:0021:0022:0023:00
Cloud cover (%)8884897874717073799197981008773605549445971847879
Rain chance (%)292829272625252627303232312621181820202325292732

Wind speed and direction

Wind & Wind gust
Time00:0001:0002:0003:0004:0005:0006:0007:0008:0009:0010:0011:0012:0013:0014:0015:0016:0017:0018:0019:0020:0021:0022:0023:00
Wind (m/s)21.891.811.811.611.311.111.1110.890.690.610.610.810.890.890.690.810.690.810.810.890.810.81
Wind gust (m/s)3.9744.114.173.563.112.692.52.332.171.941.782.312.642.672.781.751.611.441.581.641.781.751.75
Wind direction (°)SSW 208°SSW 205°SSW 204°SSW 207°SW 216°SW 222°SW 222°SW 228°SW 220°SW 214°SW 228°SW 235°WSW 241°WSW 240°WSW 238°SW 234°WSW 242°WSW 247°WSW 244°WSW 243°WSW 237°SW 234°SW 236°SW 234°

Air humidity

Humidity
Time00:0001:0002:0003:0004:0005:0006:0007:0008:0009:0010:0011:0012:0013:0014:0015:0016:0017:0018:0019:0020:0021:0022:0023:00
Humidity (%)929293939394949494949494918884828690929393949494

Atmospheric pressure

Pressure
Time00:0001:0002:0003:0004:0005:0006:0007:0008:0009:0010:0011:0012:0013:0014:0015:0016:0017:0018:0019:0020:0021:0022:0023:00
Pressure (mm Hg)765765765765765765765765764764764765765765764764764764764764764764764764

Ultraviolet index

UV Index
Time00:0001:0002:0003:0004:0005:0006:0007:0008:0009:0010:0011:0012:0013:0014:0015:0016:0017:0018:0019:0020:0021:0022:0023:00
UV Index0000000000000.20.20.20.100000000

Air quality & pollen

Air quality
Time00:0001:0002:0003:0004:0005:0006:0007:0008:0009:0010:0011:0012:0013:0014:0015:0016:0017:0018:0019:0020:0021:0022:0023:00
PM2.5 (µg/m³)0.10.20.20.20.20.20.20.20.20.30.30.30.30.30.30.30.40.40.40.50.50.50.60.6
PM10 (µg/m³)0.20.20.20.20.30.30.30.30.30.40.40.50.50.50.50.50.50.60.60.70.70.80.80.9
Ozone (O₃) (µg/m³)696968686767676666656363656769686665646464646566
NO₂ (µg/m³)0.30.20.20.20.20.20.20.20.30.50.80.90.80.50.40.50.70.911.21.21.10.90.8
SO₂ (µg/m³)00000000000000000000000.10.1
CO (µg/m³)110109109109108108108107107107106106106106106106106116.8127.5138.3149148146145

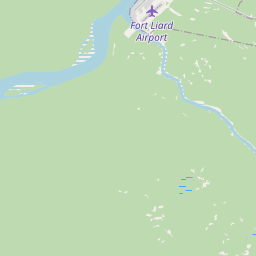
Fort Liard on the map

Data Sources & Methodology

Our weather forecasts are powered by a professional weather data provider that aggregates data from national weather services, satellite observations, radar networks, and over 80,000 weather stations worldwide. Forecast data is updated multiple times daily. We convert raw data into clear summaries — wind speed in m/s, pressure in mmHg — so you can plan your day with confidence.