5-day weather forecast Carauari Nov 15, 2026

33°24° · Fog

Weather forecast Carauari tomorrow Nov 15, 2026: fog, temperature from 24 °C to 33 °C.

Precipitation probability 73%. Wind up to 1.31 m/s (gusts 4.75 m/s). Air humidity 59–99%, atmospheric pressure 755–760 mm Hg, UV index up to 12.7.

Sunrise 06:02
Sunset 18:22
First Quarter42% illuminated
Moonrise 11:24 · Moonset 23:59
Chart
Table

Forecast from 24 °C to 33 °C and precipitation

Temperature & Precipitation
Time00:0001:0002:0003:0004:0005:0006:0007:0008:0009:0010:0011:0012:0013:0014:0015:0016:0017:0018:0019:0020:0021:0022:0023:00
Temperature (°C)252424242424242526282931323333313028272625252525
Precipitation (mm/hr)0.030.0200000000.050.090.130.230.340.520.30.180.050.020.091.540.0700.08

Cloud cover and precipitation probability

Cloud cover & Rain chance
Time00:0001:0002:0003:0004:0005:0006:0007:0008:0009:0010:0011:0012:0013:0014:0015:0016:0017:0018:0019:0020:0021:0022:0023:00
Cloud cover (%)10010010010010010010010010010099929389939595919186766563100
Rain chance (%)464543434343433830292724273640383526253373383051

Wind speed and direction

Wind & Wind gust
Time00:0001:0002:0003:0004:0005:0006:0007:0008:0009:0010:0011:0012:0013:0014:0015:0016:0017:0018:0019:0020:0021:0022:0023:00
Wind (m/s)0.310.390.50.390.50.610.810.690.890.8911.111.311.311.311.110.890.310.190.50.310.810.811
Wind gust (m/s)1.221.030.920.891.061.251.892.692.923.253.533.974.394.754.724.173.833.311.891.611.331.581.51.72
Wind direction (°)NW 316°NW 316°NW 308°WNW 293°WNW 287°W 278°W 271°W 279°WNW 283°WNW 285°WNW 294°WNW 301°NW 310°NW 317°NW 321°NW 323°NW 317°NW 309°NE 38°E 86°ENE 64°ENE 57°NE 45°NE 39°

Air humidity

Humidity
Time00:0001:0002:0003:0004:0005:0006:0007:0008:0009:0010:0011:0012:0013:0014:0015:0016:0017:0018:0019:0020:0021:0022:0023:00
Humidity (%)989899999999989590827467636059667281848793969797

Atmospheric pressure

Pressure
Time00:0001:0002:0003:0004:0005:0006:0007:0008:0009:0010:0011:0012:0013:0014:0015:0016:0017:0018:0019:0020:0021:0022:0023:00
Pressure (mm Hg)759759759758758758759759760760760760759758757756756755755756757758758758

Ultraviolet index

UV Index
Time00:0001:0002:0003:0004:0005:0006:0007:0008:0009:0010:0011:0012:0013:0014:0015:0016:0017:0018:0019:0020:0021:0022:0023:00
UV Index00000000.21.23.67.310.712.710.73.52.92.510.200000

Air quality & pollen

Air quality
Time00:0001:0002:0003:0004:0005:0006:0007:0008:0009:0010:0011:0012:0013:0014:0015:0016:0017:0018:0019:0020:0021:0022:0023:00
PM2.5 (µg/m³)6.56.76.86.96.66.56.56.56.56.36.46.16.36.26.268.17.66.96.86.76.96.86.5
PM10 (µg/m³)6.877.27.26.96.86.86.876.76.86.66.96.86.86.69.18.27.2777.176.7
Ozone (O₃) (µg/m³)171716141110142126293133343535332926232018171615
NO₂ (µg/m³)0.20.30.30.30.40.40.30.20.10000000000.10.10.20.20.30.3
SO₂ (µg/m³)0.10.10.10.10.10.10.10.10.10.10.10.10.10.10.10.10.10.10.10.10.10.10.10.1
CO (µg/m³)189188187184181179179180179176172167162156152150150150149148147146145144

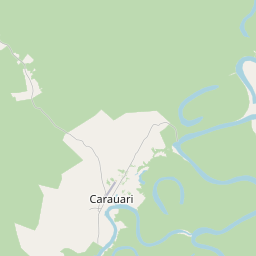
Carauari on the map

Data Sources & Methodology

Our weather forecasts are powered by a professional weather data provider that aggregates data from national weather services, satellite observations, radar networks, and over 80,000 weather stations worldwide. Forecast data is updated multiple times daily. We convert raw data into clear summaries — wind speed in m/s, pressure in mmHg — so you can plan your day with confidence.