5-day weather forecast Carauari Nov 16, 2026

33°24° · Partly cloudy

Weather forecast Carauari Monday Nov 16, 2026: partly cloudy, temperature from 24 °C to 33 °C.

Precipitation probability 50%. Wind up to 2.19 m/s (gusts 6.14 m/s). Air humidity 58–99%, atmospheric pressure 755–759 mm Hg, UV index up to 13.3.

Sunrise 06:02
Sunset 18:22
First Quarter52% illuminated
Moonrise 12:09 · Moonset does not set today
Chart
Table

Forecast from 24 °C to 33 °C and precipitation

Temperature & Precipitation
Time00:0001:0002:0003:0004:0005:0006:0007:0008:0009:0010:0011:0012:0013:0014:0015:0016:0017:0018:0019:0020:0021:0022:0023:00
Temperature (°C)252424242424242527293133333232303030282827262626
Precipitation (mm/hr)0.060.0700000000000.20.40.640.450.30.150.10.050000

Cloud cover and precipitation probability

Cloud cover & Rain chance
Time00:0001:0002:0003:0004:0005:0006:0007:0008:0009:0010:0011:0012:0013:0014:0015:0016:0017:0018:0019:0020:0021:0022:0023:00
Cloud cover (%)100100100100100100888455606065697990807077807475605345
Rain chance (%)49504343434336281813108203645453129262221191818

Wind speed and direction

Wind & Wind gust
Time00:0001:0002:0003:0004:0005:0006:0007:0008:0009:0010:0011:0012:0013:0014:0015:0016:0017:0018:0019:0020:0021:0022:0023:00
Wind (m/s)0.810.810.890.8111.191.391.391.611.892.112.192.112.1121.310.890.810.50.610.690.810.891.19
Wind gust (m/s)1.641.691.691.691.751.972.53.364.034.975.616.145.925.695.444.224.54.532.441.971.51.441.471.75
Wind direction (°)NE 40°NNE 16°NNE 14°NNE 16°NNE 17°NNE 15°N 11°N 9°N 4°N 357°N 351°NNW 345°NNW 334°NW 324°NW 315°NW 305°WNW 296°NW 326°NNW 339°NW 325°N 354°N 7°N 11°NNE 17°

Air humidity

Humidity
Time00:0001:0002:0003:0004:0005:0006:0007:0008:0009:0010:0011:0012:0013:0014:0015:0016:0017:0018:0019:0020:0021:0022:0023:00
Humidity (%)989999999999979387756658606366717172788185868889

Atmospheric pressure

Pressure
Time00:0001:0002:0003:0004:0005:0006:0007:0008:0009:0010:0011:0012:0013:0014:0015:0016:0017:0018:0019:0020:0021:0022:0023:00
Pressure (mm Hg)758758757757757757758758758759758758758757755755755755755755755755755756

Ultraviolet index

UV Index
Time00:0001:0002:0003:0004:0005:0006:0007:0008:0009:0010:0011:0012:0013:0014:0015:0016:0017:0018:0019:0020:0021:0022:0023:00
UV Index00000000.31.54.17.611.113.310.23.12.41.30.70.200000

Air quality & pollen

Air quality
Time00:0001:0002:0003:0004:0005:0006:0007:0008:0009:0010:0011:0012:0013:0014:0015:0016:0017:0018:0019:0020:0021:0022:0023:00
PM2.5 (µg/m³)6.365.75.55.254.74.23.63.12.933.13.13.13.43.53.63.83.944.14.14.2
PM10 (µg/m³)6.46.15.85.65.35.14.84.33.63.2333.23.23.23.53.63.73.83.944.14.24.2
Ozone (O₃) (µg/m³)13111091010111314151718202223232221181512111010
NO₂ (µg/m³)0.30.30.30.30.30.30.20.20.10.1000000000.10.10.20.20.20.2
SO₂ (µg/m³)0.10.10.10.10.10.10.10.10.10.10.10.10.10.10.10.10.10.10.10.10.10.10.10.1
CO (µg/m³)142139137135134133132131130130129129129128128128128128128129129128127126

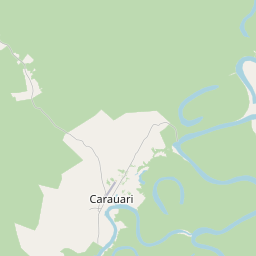
Carauari on the map

Data Sources & Methodology

Our weather forecasts are powered by a professional weather data provider that aggregates data from national weather services, satellite observations, radar networks, and over 80,000 weather stations worldwide. Forecast data is updated multiple times daily. We convert raw data into clear summaries — wind speed in m/s, pressure in mmHg — so you can plan your day with confidence.