5-day weather forecast McAlester Nov 21, 2026

22°15° · Partly cloudy

Weather forecast McAlester tomorrow Nov 21, 2026: partly cloudy, temperature from 15 °C to 22 °C.

Precipitation probability 37%. Wind up to 6.11 m/s (gusts 11.19 m/s). Air humidity 54–90%, atmospheric pressure 758–762 mm Hg, UV index up to 3.3.

Sunrise 07:03
Sunset 17:14
Waxing Gibbous95% illuminated
Moonrise 15:02 · Moonset 03:48
Chart
Table

Forecast from 15 °C to 22 °C and precipitation

Temperature & Precipitation
Time00:0001:0002:0003:0004:0005:0006:0007:0008:0009:0010:0011:0012:0013:0014:0015:0016:0017:0018:0019:0020:0021:0022:0023:00
Temperature (°C)151515151515151516171920222222222120191818171616
Precipitation (mm/hr)000000000000000000000.030.230.220.13

Cloud cover and precipitation probability

Cloud cover & Rain chance
Time00:0001:0002:0003:0004:0005:0006:0007:0008:0009:0010:0011:0012:0013:0014:0015:0016:0017:0018:0019:0020:0021:0022:0023:00
Cloud cover (%)52239555886685652454444454239385179867968767682
Rain chance (%)91214171925211917131076655712141517343737

Wind speed and direction

Wind & Wind gust
Time00:0001:0002:0003:0004:0005:0006:0007:0008:0009:0010:0011:0012:0013:0014:0015:0016:0017:0018:0019:0020:0021:0022:0023:00
Wind (m/s)3.813.693.813.813.53.53.393.53.694.194.815.56.116.116.115.8154.113.313.313.313.393.193.11
Wind gust (m/s)9.429.339.319.288.868.758.538.839.149.289.8910.3611.1911.0811.1711.1410.179.288.368.448.147.977.867.94
Wind direction (°)SSE 160°SSE 160°SSE 162°SSE 164°SSE 164°SSE 163°SSE 162°SSE 164°SSE 165°SSE 168°S 175°S 181°S 185°S 184°S 182°S 182°S 181°S 178°S 175°S 176°S 181°S 185°S 181°S 178°

Air humidity

Humidity
Time00:0001:0002:0003:0004:0005:0006:0007:0008:0009:0010:0011:0012:0013:0014:0015:0016:0017:0018:0019:0020:0021:0022:0023:00
Humidity (%)808284858687888885797164585654545862677175808690

Atmospheric pressure

Pressure
Time00:0001:0002:0003:0004:0005:0006:0007:0008:0009:0010:0011:0012:0013:0014:0015:0016:0017:0018:0019:0020:0021:0022:0023:00
Pressure (mm Hg)762762762762761761761761761761761761760759758758758758758758758759759759

Ultraviolet index

UV Index
Time00:0001:0002:0003:0004:0005:0006:0007:0008:0009:0010:0011:0012:0013:0014:0015:0016:0017:0018:0019:0020:0021:0022:0023:00
UV Index000000000.20.71.62.63.33.22.41.40.50000000

Air quality & pollen

Air quality
Time00:0001:0002:0003:0004:0005:0006:0007:0008:0009:0010:0011:0012:0013:0014:0015:0016:0017:0018:0019:0020:0021:0022:0023:00
PM2.5 (µg/m³)5.14.74.54.44.34.34.34.54.85.1654.74.85.25.55.55.55.55.55.55.55.55.3
PM10 (µg/m³)6.35.65.354.94.955.25.55.97.16.2666.46.76.76.66.66.56.56.46.46.2
Ozone (O₃) (µg/m³)716865625956545252546273818382818077757269666564
NO₂ (µg/m³)2.42.52.72.82.933.13.33.43.32.61.50.80.60.70.91.11.31.51.71.81.922
SO₂ (µg/m³)0.811.21.41.61.71.81.81.81.71.41.10.90.911.11.110.90.90.90.90.91
CO (µg/m³)131131130131133136139142145145141135131132136139140141141139137135135135

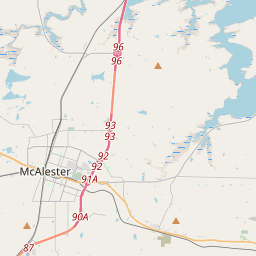
McAlester on the map

Data Sources & Methodology

Our weather forecasts are powered by a professional weather data provider that aggregates data from national weather services, satellite observations, radar networks, and over 80,000 weather stations worldwide. Forecast data is updated multiple times daily. We convert raw data into clear summaries — wind speed in m/s, pressure in mmHg — so you can plan your day with confidence.