5-day weather forecast McAlester Nov 22, 2026

16°9° · Patchy rain possible

Weather forecast McAlester Sunday Nov 22, 2026: patchy rain possible, temperature from 9 °C to 16 °C.

Precipitation probability 60%. Wind up to 5.89 m/s (gusts 11.83 m/s). Air humidity 60–97%, atmospheric pressure 758–767 mm Hg, UV index up to 1.2.

Sunrise 07:04
Sunset 17:14
Full Moon98% illuminated
Moonrise 15:33 · Moonset 04:51
Chart
Table

Forecast from 9 °C to 16 °C and precipitation

Temperature & Precipitation
Time00:0001:0002:0003:0004:0005:0006:0007:0008:0009:0010:0011:0012:0013:0014:0015:0016:0017:0018:0019:0020:0021:0022:0023:00
Temperature (°C)16161616151514141413131314141414141313121110109
Precipitation (mm/hr)0.110.050.120.260.340.310.660.10.070.070.030.03000000000000

Cloud cover and precipitation probability

Cloud cover & Rain chance
Time00:0001:0002:0003:0004:0005:0006:0007:0008:0009:0010:0011:0012:0013:0014:0015:0016:0017:0018:0019:0020:0021:0022:0023:00
Cloud cover (%)89798071857261909610010099957663444341383428211614
Rain chance (%)382934405247604738372925181310777665555

Wind speed and direction

Wind & Wind gust
Time00:0001:0002:0003:0004:0005:0006:0007:0008:0009:0010:0011:0012:0013:0014:0015:0016:0017:0018:0019:0020:0021:0022:0023:00
Wind (m/s)3.193.53.693.612.812.311.6923.195.395.55.55.695.815.895.815.615.395.195.395.615.615.395.11
Wind gust (m/s)8.228.699.179.258.727.785.695.617.9711.3111.8311.6111.4711.0811.0811.5311.1110.6910.2210.5610.8911.1711.1710.97
Wind direction (°)S 174°S 177°S 180°S 186°S 191°SSW 200°WSW 247°NW 312°NNW 337°N 349°N 353°N 355°N 359°N 1°N 1°N 3°N 4°N 4°N 2°N 3°N 5°N 7°N 10°NNE 12°

Air humidity

Humidity
Time00:0001:0002:0003:0004:0005:0006:0007:0008:0009:0010:0011:0012:0013:0014:0015:0016:0017:0018:0019:0020:0021:0022:0023:00
Humidity (%)919088899394979693908478716764636362626060606163

Atmospheric pressure

Pressure
Time00:0001:0002:0003:0004:0005:0006:0007:0008:0009:0010:0011:0012:0013:0014:0015:0016:0017:0018:0019:0020:0021:0022:0023:00
Pressure (mm Hg)759759758758759759759761761762762763763763763763764764765765766767767767

Ultraviolet index

UV Index
Time00:0001:0002:0003:0004:0005:0006:0007:0008:0009:0010:0011:0012:0013:0014:0015:0016:0017:0018:0019:0020:0021:0022:0023:00
UV Index000000000.20.50.60.81.11.20.80.30.10000000

Air quality & pollen

Air quality
Time00:0001:0002:0003:0004:0005:0006:0007:0008:0009:0010:0011:0012:0013:0014:0015:0016:0017:0018:0019:0020:0021:0022:0023:00
PM2.5 (µg/m³)5.35.254.94.84.75.466.25.12.61.31.21.31.51.722.22.42.52.52.42.22.1
PM10 (µg/m³)6.16.15.85.75.45.35.96.66.75.42.61.31.21.41.61.82.12.42.62.72.72.52.42.2
Ozone (O₃) (µg/m³)636261606061615957545147464955595958565451494848
NO₂ (µg/m³)2.12.22.22.32.52.72.93.13.23.33.43.53.43.12.72.52.733.33.43.43.33.23.1
SO₂ (µg/m³)111.11.1110.90.90.90.90.80.70.70.811.21.31.41.41.31.21.111
CO (µg/m³)136137138138137134133134136137136134132131130130130131131131130130130129

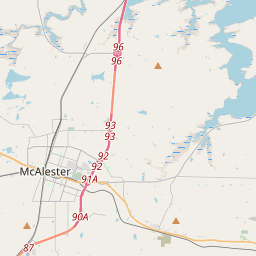
McAlester on the map

Data Sources & Methodology

Our weather forecasts are powered by a professional weather data provider that aggregates data from national weather services, satellite observations, radar networks, and over 80,000 weather stations worldwide. Forecast data is updated multiple times daily. We convert raw data into clear summaries — wind speed in m/s, pressure in mmHg — so you can plan your day with confidence.