5-day weather forecast Fort Smith Nov 21, 2026

24°12° · Partly cloudy

Weather forecast Fort Smith Saturday Nov 21, 2026: partly cloudy, temperature from 12 °C to 24 °C.

Precipitation probability 35%. Wind up to 5.19 m/s (gusts 9.11 m/s). Air humidity 48–88%, atmospheric pressure 758–764 mm Hg, UV index up to 2.7.

Sunrise 06:58
Sunset 17:08
Waxing Gibbous95% illuminated
Moonrise 14:56 · Moonset 03:42
Chart
Table

Forecast from 12 °C to 24 °C and precipitation

Temperature & Precipitation
Time00:0001:0002:0003:0004:0005:0006:0007:0008:0009:0010:0011:0012:0013:0014:0015:0016:0017:0018:0019:0020:0021:0022:0023:00
Temperature (°C)141313121212121315171921232324242221191918181717
Precipitation (mm/hr)000000000000000000000.010.010.090.18

Cloud cover and precipitation probability

Cloud cover & Rain chance
Time00:0001:0002:0003:0004:0005:0006:0007:0008:0009:0010:0011:0012:0013:0014:0015:0016:0017:0018:0019:0020:0021:0022:0023:00
Cloud cover (%)016324849516159354063819697959383736175871009288
Rain chance (%)10121518181820181291011121111101010111418222935

Wind speed and direction

Wind & Wind gust
Time00:0001:0002:0003:0004:0005:0006:0007:0008:0009:0010:0011:0012:0013:0014:0015:0016:0017:0018:0019:0020:0021:0022:0023:00
Wind (m/s)2.312.112.112.112.312.392.52.312.192.312.613.394.54.8155.194.53.813.53.813.613.53.313
Wind gust (m/s)4.443.693.563.363.894.114.284.174.644.585.757.398.838.8399.118.647.696.728.227.977.587.196.36
Wind direction (°)ESE 114°ESE 110°ESE 103°E 100°E 100°E 101°E 99°ESE 102°ESE 106°ESE 115°SE 140°SSE 164°S 175°S 176°S 174°S 172°SSE 168°SSE 156°SE 141°SE 140°SE 142°SE 142°SE 145°SSE 148°

Air humidity

Humidity
Time00:0001:0002:0003:0004:0005:0006:0007:0008:0009:0010:0011:0012:0013:0014:0015:0016:0017:0018:0019:0020:0021:0022:0023:00
Humidity (%)828486888888888579706457525048485461687073767982

Atmospheric pressure

Pressure
Time00:0001:0002:0003:0004:0005:0006:0007:0008:0009:0010:0011:0012:0013:0014:0015:0016:0017:0018:0019:0020:0021:0022:0023:00
Pressure (mm Hg)764764763763763763762763763763762761761760759758759759759759759760760759

Ultraviolet index

UV Index
Time00:0001:0002:0003:0004:0005:0006:0007:0008:0009:0010:0011:0012:0013:0014:0015:0016:0017:0018:0019:0020:0021:0022:0023:00
UV Index000000000.10.20.71.62.72.621.10.40000000

Air quality & pollen

Air quality
Time00:0001:0002:0003:0004:0005:0006:0007:0008:0009:0010:0011:0012:0013:0014:0015:0016:0017:0018:0019:0020:0021:0022:0023:00
PM2.5 (µg/m³)8.47.77.37.27.17.37.58.18.38.38.78.88.77.76.35.85.86.16.36.56.77.17.67.8
PM10 (µg/m³)10.79.89.2999.19.41010.110.411.411.611.49.98.17.57.37.788.28.69.19.79.9
Ozone (O₃) (µg/m³)656361595755545455596778868887848075706765636158
NO₂ (µg/m³)3.133.13.23.43.63.83.943.72.91.70.90.60.70.91.422.52.62.62.62.62.6
SO₂ (µg/m³)0.60.60.50.50.50.50.50.50.60.70.80.910.90.80.70.60.60.60.60.60.60.70.8
CO (µg/m³)138137136135134134135139144146142136131129129129129130131133136138137134

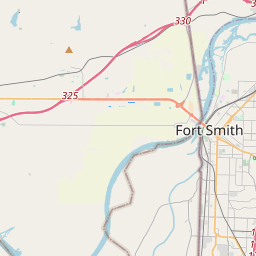
Fort Smith on the map

Data Sources & Methodology

Our weather forecasts are powered by a professional weather data provider that aggregates data from national weather services, satellite observations, radar networks, and over 80,000 weather stations worldwide. Forecast data is updated multiple times daily. We convert raw data into clear summaries — wind speed in m/s, pressure in mmHg — so you can plan your day with confidence.