5-day weather forecast Cascavel Nov 22, 2026

32°27° · Patchy rain possible

Weather forecast Cascavel Sunday Nov 22, 2026: patchy rain possible, temperature from 27 °C to 32 °C.

Precipitation probability 25%. Wind up to 5.89 m/s (gusts 10.31 m/s). Air humidity 59–83%, atmospheric pressure 758–761 mm Hg, UV index up to 10.7.

Sunrise 05:09
Sunset 17:28
Full Moon98% illuminated
Moonrise 15:36 · Moonset 03:01
Chart
Table

Forecast from 27 °C to 32 °C and precipitation

Temperature & Precipitation
Time00:0001:0002:0003:0004:0005:0006:0007:0008:0009:0010:0011:0012:0013:0014:0015:0016:0017:0018:0019:0020:0021:0022:0023:00
Temperature (°C)272727272727282829303031323131302929282727272727
Precipitation (mm/hr)00000.030.040.060.070.040.040.030.0100000000.020.050.070.080.1

Cloud cover and precipitation probability

Cloud cover & Rain chance
Time00:0001:0002:0003:0004:0005:0006:0007:0008:0009:0010:0011:0012:0013:0014:0015:0016:0017:0018:0019:0020:0021:0022:0023:00
Cloud cover (%)202222237555585451728877964132546727261515762
Rain chance (%)1010101120171717121315124445711171919192225

Wind speed and direction

Wind & Wind gust
Time00:0001:0002:0003:0004:0005:0006:0007:0008:0009:0010:0011:0012:0013:0014:0015:0016:0017:0018:0019:0020:0021:0022:0023:00
Wind (m/s)4.894.814.614.394.394.614.695.115.315.695.695.695.895.695.55.315.3154.814.8955.115.115
Wind gust (m/s)8.618.257.867.477.57.697.728.589.2210.1110.0810.1710.3110.119.929.789.539.229.229.179.038.758.678.56
Wind direction (°)E 80°E 81°E 81°E 82°E 87°E 89°E 92°E 91°E 90°E 90°E 89°E 86°E 82°E 79°ENE 77°ENE 74°ENE 74°ENE 73°ENE 70°ENE 72°ENE 73°ENE 74°ENE 78°E 82°

Air humidity

Humidity
Time00:0001:0002:0003:0004:0005:0006:0007:0008:0009:0010:0011:0012:0013:0014:0015:0016:0017:0018:0019:0020:0021:0022:0023:00
Humidity (%)787979808078747169666461596163656974787980808183

Atmospheric pressure

Pressure
Time00:0001:0002:0003:0004:0005:0006:0007:0008:0009:0010:0011:0012:0013:0014:0015:0016:0017:0018:0019:0020:0021:0022:0023:00
Pressure (mm Hg)759758758758758758759760760761760760759758758758758758758758759759759759

Ultraviolet index

UV Index
Time00:0001:0002:0003:0004:0005:0006:0007:0008:0009:0010:0011:0012:0013:0014:0015:0016:0017:0018:0019:0020:0021:0022:0023:00
UV Index0000000.10.72.23.75.17.610.710.47.23.91.40.3000000

Air quality & pollen

Air quality
Time00:0001:0002:0003:0004:0005:0006:0007:0008:0009:0010:0011:0012:0013:0014:0015:0016:0017:0018:0019:0020:0021:0022:0023:00
PM2.5 (µg/m³)9.39.18.88.58.17.87.46.96.46.1666.36.77.17.37.77.98.18.48.79.19.610
PM10 (µg/m³)16.115.515.114.61413.412.711.91110.410.210.310.811.31212.513.113.61414.615.115.816.717.3
Ozone (O₃) (µg/m³)454544444443434344454647484950504948474644434241
NO₂ (µg/m³)0.40.40.40.40.40.40.40.40.30.30.30.20.20.20.20.20.30.30.40.40.40.40.40.4
SO₂ (µg/m³)0.30.30.30.30.30.30.30.30.30.30.30.30.30.30.30.30.30.30.30.30.30.30.30.3
CO (µg/m³)108109109110111112113113113113112112111111110110110110110110109109109108

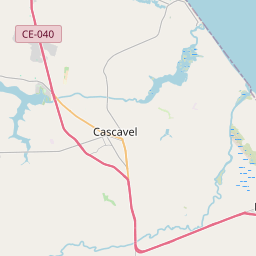
Cascavel on the map

Data Sources & Methodology

Our weather forecasts are powered by a professional weather data provider that aggregates data from national weather services, satellite observations, radar networks, and over 80,000 weather stations worldwide. Forecast data is updated multiple times daily. We convert raw data into clear summaries — wind speed in m/s, pressure in mmHg — so you can plan your day with confidence.