5-day weather forecast Cascavel Nov 21, 2026

32°27° · Patchy rain possible

Weather forecast Cascavel tomorrow Nov 21, 2026: patchy rain possible, temperature from 27 °C to 32 °C.

Precipitation probability 19%. Wind up to 5.61 m/s (gusts 9.67 m/s). Air humidity 54–77%, atmospheric pressure 758–761 mm Hg, UV index up to 12.5.

Sunrise 05:09
Sunset 17:28
Waxing Gibbous95% illuminated
Moonrise 14:47 · Moonset 02:17
Chart
Table

Forecast from 27 °C to 32 °C and precipitation

Temperature & Precipitation
Time00:0001:0002:0003:0004:0005:0006:0007:0008:0009:0010:0011:0012:0013:0014:0015:0016:0017:0018:0019:0020:0021:0022:0023:00
Temperature (°C)272727272727272829303131323131303029272727272727
Precipitation (mm/hr)0000.010.010.020.030.050.070.090.070.050.020.020.01000000000

Cloud cover and precipitation probability

Cloud cover & Rain chance
Time00:0001:0002:0003:0004:0005:0006:0007:0008:0009:0010:0011:0012:0013:0014:0015:0016:0017:0018:0019:0020:0021:0022:0023:00
Cloud cover (%)192132787983788887817281868678131514162418181716
Rain chance (%)889161719171818171712121110456899899

Wind speed and direction

Wind & Wind gust
Time00:0001:0002:0003:0004:0005:0006:0007:0008:0009:0010:0011:0012:0013:0014:0015:0016:0017:0018:0019:0020:0021:0022:0023:00
Wind (m/s)4.894.894.694.54.54.394.55.115.395.615.55.55.395.315.114.894.694.3944.314.6955.115.11
Wind gust (m/s)8.868.728.477.947.897.647.898.539.119.679.649.539.589.369.179.038.568.287.978.368.618.618.758.78
Wind direction (°)ENE 78°ENE 78°E 79°E 82°E 84°E 87°E 91°E 89°E 89°E 89°E 88°E 85°E 82°E 80°E 80°ENE 78°ENE 78°ENE 75°ENE 70°ENE 67°ENE 65°ENE 65°ENE 69°ENE 75°

Air humidity

Humidity
Time00:0001:0002:0003:0004:0005:0006:0007:0008:0009:0010:0011:0012:0013:0014:0015:0016:0017:0018:0019:0020:0021:0022:0023:00
Humidity (%)757474737475736762585654545556596368747576757677

Atmospheric pressure

Pressure
Time00:0001:0002:0003:0004:0005:0006:0007:0008:0009:0010:0011:0012:0013:0014:0015:0016:0017:0018:0019:0020:0021:0022:0023:00
Pressure (mm Hg)759759758758758759759760760761760760759758758758758758758759759759759759

Ultraviolet index

UV Index
Time00:0001:0002:0003:0004:0005:0006:0007:0008:0009:0010:0011:0012:0013:0014:0015:0016:0017:0018:0019:0020:0021:0022:0023:00
UV Index0000000.21.33.66.910.312.412.510.67.441.40.3000000

Air quality & pollen

Air quality
Time00:0001:0002:0003:0004:0005:0006:0007:0008:0009:0010:0011:0012:0013:0014:0015:0016:0017:0018:0019:0020:0021:0022:0023:00
PM2.5 (µg/m³)12.111.510.79.898.48.28.18.29.49.79.29.610.110.310.410.19.79.59.59.59.79.79.6
PM10 (µg/m³)20.719.618.316.915.614.614.113.914.116.116.515.616.217.117.317.51716.416.116.216.216.616.616.6
Ozone (O₃) (µg/m³)474748494949494950505050505050505050505049484746
NO₂ (µg/m³)0.40.40.30.30.30.30.30.30.20.20.20.20.20.20.20.20.30.30.40.40.40.40.40.4
SO₂ (µg/m³)0.20.20.20.20.20.20.20.20.20.20.20.30.30.30.30.30.30.30.30.30.30.30.30.3
CO (µg/m³)10110210310310299989899100100100100101101102103103104105106107107108

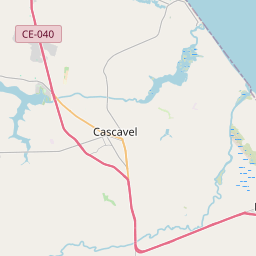
Cascavel on the map

Data Sources & Methodology

Our weather forecasts are powered by a professional weather data provider that aggregates data from national weather services, satellite observations, radar networks, and over 80,000 weather stations worldwide. Forecast data is updated multiple times daily. We convert raw data into clear summaries — wind speed in m/s, pressure in mmHg — so you can plan your day with confidence.