5-day weather forecast Bikaner Nov 17, 2026

29°16° · Sunny

Weather forecast Bikaner Tuesday Nov 17, 2026: sunny, temperature from 16 °C to 29 °C.

Precipitation probability 1%. Wind up to 2 m/s (gusts 3.33 m/s). Air humidity 16–46%, atmospheric pressure 760–762 mm Hg, UV index up to 4.9.

Sunrise 07:00
Sunset 17:43
First Quarter63% illuminated
Moonrise 13:16 · Moonset does not set today
Chart
Table

Forecast from 16 °C to 29 °C and precipitation

Temperature & Precipitation
Time00:0001:0002:0003:0004:0005:0006:0007:0008:0009:0010:0011:0012:0013:0014:0015:0016:0017:0018:0019:0020:0021:0022:0023:00
Temperature (°C)191918171716171819222527282829282725242322212020
Precipitation (mm/hr)000000000000000000000000

Cloud cover and precipitation probability

Cloud cover & Rain chance
Time00:0001:0002:0003:0004:0005:0006:0007:0008:0009:0010:0011:0012:0013:0014:0015:0016:0017:0018:0019:0020:0021:0022:0023:00
Cloud cover (%)000000000000000000000000
Rain chance (%)111111111100000000000000

Wind speed and direction

Wind & Wind gust
Time00:0001:0002:0003:0004:0005:0006:0007:0008:0009:0010:0011:0012:0013:0014:0015:0016:0017:0018:0019:0020:0021:0022:0023:00
Wind (m/s)1.11111.111.191.191.391.51.811.611.390.890.190.611.191.191.191.1111.111.391.691.892
Wind gust (m/s)2.061.891.891.861.942.032.532.863.283.253.333.082.922.892.922.752.582.221.891.781.862.332.582.75
Wind direction (°)ENE 63°E 84°E 100°ESE 113°ESE 114°ESE 110°ESE 113°ESE 123°SE 132°SE 139°SE 145°SE 146°E 94°N 353°NNW 346°N 353°N 3°NNE 16°NE 34°NE 50°ENE 61°ENE 77°E 89°ESE 103°

Air humidity

Humidity
Time00:0001:0002:0003:0004:0005:0006:0007:0008:0009:0010:0011:0012:0013:0014:0015:0016:0017:0018:0019:0020:0021:0022:0023:00
Humidity (%)373941434546444239332721191716171821222324252728

Atmospheric pressure

Pressure
Time00:0001:0002:0003:0004:0005:0006:0007:0008:0009:0010:0011:0012:0013:0014:0015:0016:0017:0018:0019:0020:0021:0022:0023:00
Pressure (mm Hg)761760760760760761761761762762762762761761761760761761761761761762762762

Ultraviolet index

UV Index
Time00:0001:0002:0003:0004:0005:0006:0007:0008:0009:0010:0011:0012:0013:0014:0015:0016:0017:0018:0019:0020:0021:0022:0023:00
UV Index000000000.51.52.94.34.94.53.31.80.70000000

Air quality & pollen

Air quality
Time00:0001:0002:0003:0004:0005:0006:0007:0008:0009:0010:0011:0012:0013:0014:0015:0016:0017:0018:0019:0020:0021:0022:0023:00
PM2.5 (µg/m³)3030.230.330.330.330.230.731.329.927.826.323.319.417.215.815.11515.716.917.818.519.219.619.8
PM10 (µg/m³)33.833.93434.13433.934.234.632.830.930.527.522.920.218.417.517.317.518.419.219.920.52121.1
Ozone (O₃) (µg/m³)636057555352504955751031241321321301261191111008777726967
NO₂ (µg/m³)9.69.59.59.59.49.49.710.19.77.74.82.61.61.11.32.13.4579.210.811.210.810.4
SO₂ (µg/m³)7.17.47.88.399.710.611.612.312.612.712.210.78.77.26.97.17.47.57.67.67.47.16.7
CO (µg/m³)343321307301303313344384398362300250222207214256321379430475490452383326

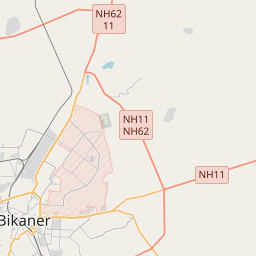
Bikaner on the map

Data Sources & Methodology

Our weather forecasts are powered by a professional weather data provider that aggregates data from national weather services, satellite observations, radar networks, and over 80,000 weather stations worldwide. Forecast data is updated multiple times daily. We convert raw data into clear summaries — wind speed in m/s, pressure in mmHg — so you can plan your day with confidence.