5-day weather forecast Surabaya Oct 31, 2026

35°26° · Smoky haze

Weather forecast Surabaya Saturday Oct 31, 2026: smoky haze, temperature from 26 °C to 35 °C.

Precipitation probability 39%. Wind up to 4.19 m/s (gusts 7.92 m/s). Air humidity 34–86%, atmospheric pressure 758–761 mm Hg, UV index up to 12.8.

Sunrise 05:01
Sunset 17:23
Last Quarter61% illuminated
Moonrise 22:18 · Moonset 09:17
Chart
Table

Forecast from 26 °C to 35 °C and precipitation

Temperature & Precipitation
Time00:0001:0002:0003:0004:0005:0006:0007:0008:0009:0010:0011:0012:0013:0014:0015:0016:0017:0018:0019:0020:0021:0022:0023:00
Temperature (°C)282628272627272830323334343435343231313030292928
Precipitation (mm/hr)0.250000000000000000.020.120.060.010.050.020.170.32

Cloud cover and precipitation probability

Cloud cover & Rain chance
Time00:0001:0002:0003:0004:0005:0006:0007:0008:0009:0010:0011:0012:0013:0014:0015:0016:0017:0018:0019:0020:0021:0022:0023:00
Cloud cover (%)895655250034616057558184837683548699
Rain chance (%)33178813989422111111018171416113039

Wind speed and direction

Wind & Wind gust
Time00:0001:0002:0003:0004:0005:0006:0007:0008:0009:0010:0011:0012:0013:0014:0015:0016:0017:0018:0019:0020:0021:0022:0023:00
Wind (m/s)2.890.391.690.610.391.391.810.811.190.51.891.893.313.393.193.3133.613.814.194.1943.113.39
Wind gust (m/s)4.53.613.191.611.445.394.812.145.190.895.612.723.617.613.924.316.865.1167.925.55.316.175
Wind direction (°)E 92°SE 139°ESE 104°SE 139°W 275°WNW 293°W 277°WNW 286°W 279°W 279°E 100°E 91°E 92°ESE 105°E 83°NE 55°E 83°ESE 105°E 101°E 97°E 95°ESE 104°ESE 112°ESE 103°

Air humidity

Humidity
Time00:0001:0002:0003:0004:0005:0006:0007:0008:0009:0010:0011:0012:0013:0014:0015:0016:0017:0018:0019:0020:0021:0022:0023:00
Humidity (%)748376768679777462545144404534395155586966707374

Atmospheric pressure

Pressure
Time00:0001:0002:0003:0004:0005:0006:0007:0008:0009:0010:0011:0012:0013:0014:0015:0016:0017:0018:0019:0020:0021:0022:0023:00
Pressure (mm Hg)760760759759760760761761761761761760759758758758758759759760761761761761

Ultraviolet index

UV Index
Time00:0001:0002:0003:0004:0005:0006:0007:0008:0009:0010:0011:0012:0013:0014:0015:0016:0017:0018:0019:0020:0021:0022:0023:00
UV Index0000000.21.33.87.210.512.812.810.77.33.91.40.2000000

Air quality & pollen

Air quality
Time00:0001:0002:0003:0004:0005:0006:0007:0008:0009:0010:0011:0012:0013:0014:0015:0016:0017:0018:0019:0020:0021:0022:0023:00
PM2.5 (µg/m³)152.7163160.7170.4182.5193.2178.3814030.426.326.428.329.529.729.429.841.178.588.283.683.192.2104.5
PM10 (µg/m³)152.7163.4161.6171.4184.9197.918382.241.93227.127.329.230.430.630.430.742.682.291.386.185.294.3106.6
Ozone (O₃) (µg/m³)81000102441628610913315516816815913910051141010
NO₂ (µg/m³)105.6108.4109.4107.9101.988.971.355.141.629.319.713.39.5878.316.538.86887.788.880.373.171.1
SO₂ (µg/m³)48.74848.750.152.959.367.170.666.457.849.341.63428.727.127.829.131.23435.433.830.92929.7
CO (µg/m³)2972233620011789170818842191225918321164654475452458457483516557603626607564519475

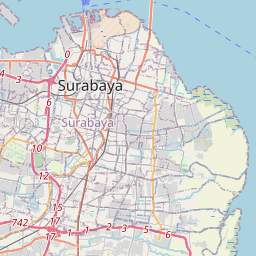
Surabaya on the map

Data Sources & Methodology

Our weather forecasts are powered by a professional weather data provider that aggregates data from national weather services, satellite observations, radar networks, and over 80,000 weather stations worldwide. Forecast data is updated multiple times daily. We convert raw data into clear summaries — wind speed in m/s, pressure in mmHg — so you can plan your day with confidence.