5-day weather forecast Surabaya Oct 30, 2026

35°27° · Patchy rain possible

Weather forecast Surabaya tomorrow Oct 30, 2026: patchy rain possible, temperature from 27 °C to 35 °C.

Precipitation probability 65%. Wind up to 5 m/s (gusts 9.31 m/s). Air humidity 42–88%, atmospheric pressure 758–761 mm Hg, UV index up to 12.8.

Sunrise 05:01
Sunset 17:23
Waning Gibbous71% illuminated
Moonrise 21:19 · Moonset 08:15
Chart
Table

Forecast from 27 °C to 35 °C and precipitation

Temperature & Precipitation
Time00:0001:0002:0003:0004:0005:0006:0007:0008:0009:0010:0011:0012:0013:0014:0015:0016:0017:0018:0019:0020:0021:0022:0023:00
Temperature (°C)282728282727282931333335353335343131302729292728
Precipitation (mm/hr)0.740.07000.02000.01000000.08000.170.140.131.050.330.120.220.74

Cloud cover and precipitation probability

Cloud cover & Rain chance
Time00:0001:0002:0003:0004:0005:0006:0007:0008:0009:0010:0011:0012:0013:0014:0015:0016:0017:0018:0019:0020:0021:0022:0023:00
Cloud cover (%)838122453100446386462368486668626810010089998190100
Rain chance (%)5030792022111512546417661923246542234656

Wind speed and direction

Wind & Wind gust
Time00:0001:0002:0003:0004:0005:0006:0007:0008:0009:0010:0011:0012:0013:0014:0015:0016:0017:0018:0019:0020:0021:0022:0023:00
Wind (m/s)1.391.110.610.810.610.690.690.390.310.111233.113.694.314.1954.391.394.193.8113.11
Wind gust (m/s)1.812.441.111.111.4410.722.280.50.614.44776.868.699.317.56.1166.255.645.423.614.83
Wind direction (°)SE 134°SE 146°SSW 198°SW 231°SW 234°W 264°W 260°SSW 208°W 265°NW 323°E 88°E 86°E 87°E 93°E 83°E 91°ESE 114°ESE 109°ESE 105°ESE 115°ESE 105°ESE 106°ESE 102°E 98°

Air humidity

Humidity
Time00:0001:0002:0003:0004:0005:0006:0007:0008:0009:0010:0011:0012:0013:0014:0015:0016:0017:0018:0019:0020:0021:0022:0023:00
Humidity (%)728775768878757761545746445042465858628268718675

Atmospheric pressure

Pressure
Time00:0001:0002:0003:0004:0005:0006:0007:0008:0009:0010:0011:0012:0013:0014:0015:0016:0017:0018:0019:0020:0021:0022:0023:00
Pressure (mm Hg)759759759759760760761761761761761760758758758758758759759761761761761761

Ultraviolet index

UV Index
Time00:0001:0002:0003:0004:0005:0006:0007:0008:0009:0010:0011:0012:0013:0014:0015:0016:0017:0018:0019:0020:0021:0022:0023:00
UV Index0000000.21.33.77.110.412.812.810.77.33.81.40.2000000

Air quality & pollen

Air quality
Time00:0001:0002:0003:0004:0005:0006:0007:0008:0009:0010:0011:0012:0013:0014:0015:0016:0017:0018:0019:0020:0021:0022:0023:00
PM2.5 (µg/m³)116.9130.9146.2144.4140.6143.9145.386.858.646.342.542.44443.542.643.845.142.449.656.568.980.195.7110.4
PM10 (µg/m³)119.7133.6149147.1143.4146.7148.590.861.24743.243.144.744.243.244.445.643.150.15769.480.395.9110.6
Ozone (O₃) (µg/m³)131019224272110143171195210213207189152102623926169
NO₂ (µg/m³)83.781.983.285.584.57868.458.448.738.629.721.714.810.910.813.719.328.339.951.56374.583.889.8
SO₂ (µg/m³)27.826.825.825.528.738.251.161.869.174.274.566.754.244.641.942.241.537.432.429.731.535.839.340.9
CO (µg/m³)3833474997529731129125413211317125411429456985214344165218801362162414301017755830

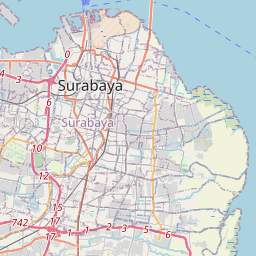
Surabaya on the map

Data Sources & Methodology

Our weather forecasts are powered by a professional weather data provider that aggregates data from national weather services, satellite observations, radar networks, and over 80,000 weather stations worldwide. Forecast data is updated multiple times daily. We convert raw data into clear summaries — wind speed in m/s, pressure in mmHg — so you can plan your day with confidence.