5-day weather forecast Sihui Nov 19, 2026

17°15° · Patchy rain possible

Weather forecast Sihui Thursday Nov 19, 2026: patchy rain possible, temperature from 15 °C to 17 °C.

Precipitation probability 57%. Wind up to 4.31 m/s (gusts 7.78 m/s). Air humidity 67–75%, atmospheric pressure 767–770 mm Hg, UV index up to 0.8.

Sunrise 06:45
Sunset 17:42
Waxing Gibbous81% illuminated
Moonrise 14:00 · Moonset 01:28
Chart
Table

Forecast from 15 °C to 17 °C and precipitation

Temperature & Precipitation
Time00:0001:0002:0003:0004:0005:0006:0007:0008:0009:0010:0011:0012:0013:0014:0015:0016:0017:0018:0019:0020:0021:0022:0023:00
Temperature (°C)171716161616161616161616161616161616161615151515
Precipitation (mm/hr)0000000.270.530.80.590.390.280.390.620.150.080.250.060.120.10.10.10.140.07

Cloud cover and precipitation probability

Cloud cover & Rain chance
Time00:0001:0002:0003:0004:0005:0006:0007:0008:0009:0010:0011:0012:0013:0014:0015:0016:0017:0018:0019:0020:0021:0022:0023:00
Cloud cover (%)9999899399100968994100100100100100100999896959493919089
Rain chance (%)181816171717334554554843495729253923282728282924

Wind speed and direction

Wind & Wind gust
Time00:0001:0002:0003:0004:0005:0006:0007:0008:0009:0010:0011:0012:0013:0014:0015:0016:0017:0018:0019:0020:0021:0022:0023:00
Wind (m/s)44.1143.893.893.893.893.894.194.314.113.893.813.693.693.693.53.393.1932.812.892.893
Wind gust (m/s)7.587.757.647.537.427.287.337.447.647.537.397.257.427.447.787.447.066.566.2865.585.755.755.75
Wind direction (°)N 6°N 8°N 7°N 8°N 10°NNE 13°NNE 12°NNE 14°NNE 13°NNE 13°NNE 16°NNE 12°N 8°NNE 12°NNE 12°NNE 12°N 8°N 9°N 8°N 9°N 8°N 9°NNE 12°NNE 13°

Air humidity

Humidity
Time00:0001:0002:0003:0004:0005:0006:0007:0008:0009:0010:0011:0012:0013:0014:0015:0016:0017:0018:0019:0020:0021:0022:0023:00
Humidity (%)706969696867686970707172727270707171727475747473

Atmospheric pressure

Pressure
Time00:0001:0002:0003:0004:0005:0006:0007:0008:0009:0010:0011:0012:0013:0014:0015:0016:0017:0018:0019:0020:0021:0022:0023:00
Pressure (mm Hg)768768767767767767768768769769770770769768767767767767768768769769769769

Ultraviolet index

UV Index
Time00:0001:0002:0003:0004:0005:0006:0007:0008:0009:0010:0011:0012:0013:0014:0015:0016:0017:0018:0019:0020:0021:0022:0023:00
UV Index000000000.20.80.60.50.40.50.50.20.10000000

Air quality & pollen

Air quality
Time00:0001:0002:0003:0004:0005:0006:0007:0008:0009:0010:0011:0012:0013:0014:0015:0016:0017:0018:0019:0020:0021:0022:0023:00
PM2.5 (µg/m³)109.59.69.810.311.412.715.51818.418.718.318.318.218.819.219.722.133.642.14339.835.727.8
PM10 (µg/m³)10.19.79.71010.511.512.915.718.318.719.218.818.818.719.319.720.222.53442.443.240.23628
Ozone (O₃) (µg/m³)20191920212223242835435469869810410599825842425058
NO₂ (µg/m³)34.332.230.228.326.625.224.524.122.919.916.11310.89.49.510.913.919.932.648.357.253.843.834
SO₂ (µg/m³)10.810.710.610.610.710.710.710.610.510.310.19.79.18.57.97.476.87.17.67.87.67.16.5
CO (µg/m³)433455475490503516535555561539503478480494499485461442436434418373314267

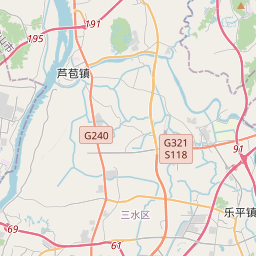
Sihui on the map

Data Sources & Methodology

Our weather forecasts are powered by a professional weather data provider that aggregates data from national weather services, satellite observations, radar networks, and over 80,000 weather stations worldwide. Forecast data is updated multiple times daily. We convert raw data into clear summaries — wind speed in m/s, pressure in mmHg — so you can plan your day with confidence.