5-day weather forecast Panama City Beach Nov 12, 2026

23°16° · Cloudy

Weather forecast Panama City Beach Thursday Nov 12, 2026: cloudy, temperature from 16 °C to 23 °C.

Precipitation probability 44%. Wind up to 5.31 m/s (gusts 8.67 m/s). Air humidity 57–81%, atmospheric pressure 757–761 mm Hg, UV index up to 3.3.

Sunrise 06:06
Sunset 16:48
Waxing Crescent14% illuminated
Moonrise 09:34 · Moonset 19:34
Chart
Table

Forecast from 16 °C to 23 °C and precipitation

Temperature & Precipitation
Time00:0001:0002:0003:0004:0005:0006:0007:0008:0009:0010:0011:0012:0013:0014:0015:0016:0017:0018:0019:0020:0021:0022:0023:00
Temperature (°C)212121212121212121212122232323232322212019181716
Precipitation (mm/hr)000.010.010.190.160.070.020.01000000000000000

Cloud cover and precipitation probability

Cloud cover & Rain chance
Time00:0001:0002:0003:0004:0005:0006:0007:0008:0009:0010:0011:0012:0013:0014:0015:0016:0017:0018:0019:0020:0021:0022:0023:00
Cloud cover (%)79869310010010010098979586776877879697991009589846456
Rain chance (%)1719222444373024222017141111121314141413131299

Wind speed and direction

Wind & Wind gust
Time00:0001:0002:0003:0004:0005:0006:0007:0008:0009:0010:0011:0012:0013:0014:0015:0016:0017:0018:0019:0020:0021:0022:0023:00
Wind (m/s)3.894.114.394.54.815.115.195.195.195.314.814.54.54.81554.894.694.814.814.89555.11
Wind gust (m/s)5.676.066.56.677.117.587.727.758.148.177.116.786.56.867.147.257.537.477.647.978.258.58.538.67
Wind direction (°)W 265°W 272°W 279°WNW 288°WNW 290°WNW 292°WNW 293°WNW 298°WNW 302°NW 305°WNW 303°WNW 295°WNW 282°W 279°W 276°W 277°WNW 294°NW 310°NNW 327°NNW 336°NNW 342°N 349°N 350°N 350°

Air humidity

Humidity
Time00:0001:0002:0003:0004:0005:0006:0007:0008:0009:0010:0011:0012:0013:0014:0015:0016:0017:0018:0019:0020:0021:0022:0023:00
Humidity (%)757779808181817977757370676361595958575859616264

Atmospheric pressure

Pressure
Time00:0001:0002:0003:0004:0005:0006:0007:0008:0009:0010:0011:0012:0013:0014:0015:0016:0017:0018:0019:0020:0021:0022:0023:00
Pressure (mm Hg)761760760759759759759759760760759759758758757757757758758758758759759759

Ultraviolet index

UV Index
Time00:0001:0002:0003:0004:0005:0006:0007:0008:0009:0010:0011:0012:0013:0014:0015:0016:0017:0018:0019:0020:0021:0022:0023:00
UV Index00000000.10.5122.73.32.11.610.30000000

Air quality & pollen

Air quality
Time00:0001:0002:0003:0004:0005:0006:0007:0008:0009:0010:0011:0012:0013:0014:0015:0016:0017:0018:0019:0020:0021:0022:0023:00
PM2.5 (µg/m³)4.13.83.53.44.35.46.36.86.96.66.365.65.45.14.84.54.24.14.14.44.74.94.7
PM10 (µg/m³)54.643.64.45.56.36.86.96.66.46.15.75.55.354.64.34.14.24.54.854.9
Ozone (O₃) (µg/m³)78787980838890888483869296991001009689848078767575
NO₂ (µg/m³)21.71.61.61.92.42.82.92.92.72.21.510.80.70.91.42.22.72.92.92.82.72.6
SO₂ (µg/m³)0.70.70.811.52.12.52.52.32.11.81.51.210.90.80.70.70.70.70.80.80.80.8
CO (µg/m³)117119122125129133137140144145144142139135130128130135139142144145142138

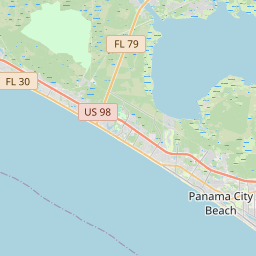
Panama City Beach on the map

Data Sources & Methodology

Our weather forecasts are powered by a professional weather data provider that aggregates data from national weather services, satellite observations, radar networks, and over 80,000 weather stations worldwide. Forecast data is updated multiple times daily. We convert raw data into clear summaries — wind speed in m/s, pressure in mmHg — so you can plan your day with confidence.