5-day weather forecast Lwamba Nov 19, 2026

31°19° · Patchy rain possible

Weather forecast Lwamba Thursday Nov 19, 2026: patchy rain possible, temperature from 19 °C to 31 °C.

Precipitation probability 33%. Wind up to 2.69 m/s (gusts 4.42 m/s). Air humidity 44–94%, atmospheric pressure 758–761 mm Hg, UV index up to 12.2.

Sunrise 06:29
Sunset 18:33
Waxing Gibbous81% illuminated
Moonrise 14:24 · Moonset 02:03
Chart
Table

Forecast from 19 °C to 31 °C and precipitation

Temperature & Precipitation
Time00:0001:0002:0003:0004:0005:0006:0007:0008:0009:0010:0011:0012:0013:0014:0015:0016:0017:0018:0019:0020:0021:0022:0023:00
Temperature (°C)212121202020192123252628293031313029262524222222
Precipitation (mm/hr)00.110.14000000000.010.010.020.030.050.050.050.050.040.02000

Cloud cover and precipitation probability

Cloud cover & Rain chance
Time00:0001:0002:0003:0004:0005:0006:0007:0008:0009:0010:0011:0012:0013:0014:0015:0016:0017:0018:0019:0020:0021:0022:0023:00
Cloud cover (%)28765142161821191744576056837587868073827518147
Rain chance (%)15333019161621141110986109111217171515111112

Wind speed and direction

Wind & Wind gust
Time00:0001:0002:0003:0004:0005:0006:0007:0008:0009:0010:0011:0012:0013:0014:0015:0016:0017:0018:0019:0020:0021:0022:0023:00
Wind (m/s)1.311111.111.191.191.191.311.391.311.311.311.110.810.511.812.692.392.392.1122
Wind gust (m/s)2.281.811.51.421.641.781.642.392.973.333.393.533.863.673.583.423.673.924.424.174.394.314.084.06
Wind direction (°)SSE 159°SSE 155°SE 140°SE 142°SE 144°SE 140°SE 134°SSE 155°SSE 166°S 174°SSW 193°SW 217°SW 227°SW 226°SW 225°SW 236°SW 221°SSW 213°SSW 213°SSW 210°SSW 200°S 177°S 173°S 170°

Air humidity

Humidity
Time00:0001:0002:0003:0004:0005:0006:0007:0008:0009:0010:0011:0012:0013:0014:0015:0016:0017:0018:0019:0020:0021:0022:0023:00
Humidity (%)888991919293948981736456504846444752596370808485

Atmospheric pressure

Pressure
Time00:0001:0002:0003:0004:0005:0006:0007:0008:0009:0010:0011:0012:0013:0014:0015:0016:0017:0018:0019:0020:0021:0022:0023:00
Pressure (mm Hg)761760760760760760761761761761761761760759758758758758758758759760760760

Ultraviolet index

UV Index
Time00:0001:0002:0003:0004:0005:0006:0007:0008:0009:0010:0011:0012:0013:0014:0015:0016:0017:0018:0019:0020:0021:0022:0023:00
UV Index000000000.82.75.89.111.512.210.67.74.31.60.300000

Air quality & pollen

Air quality
Time00:0001:0002:0003:0004:0005:0006:0007:0008:0009:0010:0011:0012:0013:0014:0015:0016:0017:0018:0019:0020:0021:0022:0023:00
PM2.5 (µg/m³)20.321.122.324242630.237.134.122.914.112.111.210.59.58.78.37.77.91216.819.220.320.3
PM10 (µg/m³)20.821.722.924.824.92731.438.535.42415.313.612.912.210.99.898.38.212.517.319.720.820.8
Ozone (O₃) (µg/m³)48444037333033476682919699100100989692877866575352
NO₂ (µg/m³)8.49.510.812.214.216.316.513.17.93.71.91.20.80.60.60.80.811.73.66.188.48.2
SO₂ (µg/m³)1.71.81.81.922.12.12.121.91.61.310.90.80.80.70.70.711.31.61.71.6
CO (µg/m³)441447443445468497500452378321300295289275261252251255264278297317337359

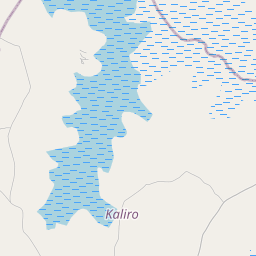
Lwamba on the map

Data Sources & Methodology

Our weather forecasts are powered by a professional weather data provider that aggregates data from national weather services, satellite observations, radar networks, and over 80,000 weather stations worldwide. Forecast data is updated multiple times daily. We convert raw data into clear summaries — wind speed in m/s, pressure in mmHg — so you can plan your day with confidence.