5-day weather forecast Lwamba Nov 18, 2026

31°19° · Partly cloudy

Weather forecast Lwamba tomorrow Nov 18, 2026: partly cloudy, temperature from 19 °C to 31 °C.

Precipitation probability 29%. Wind up to 2.61 m/s (gusts 5.14 m/s). Air humidity 41–94%, atmospheric pressure 757–761 mm Hg, UV index up to 12.3.

Sunrise 06:29
Sunset 18:33
Waxing Gibbous73% illuminated
Moonrise 13:44 · Moonset 01:22
Chart
Table

Forecast from 19 °C to 31 °C and precipitation

Temperature & Precipitation
Time00:0001:0002:0003:0004:0005:0006:0007:0008:0009:0010:0011:0012:0013:0014:0015:0016:0017:0018:0019:0020:0021:0022:0023:00
Temperature (°C)212020202020192122242627293030313029282624232222
Precipitation (mm/hr)0000000000.010.010.020.020.020.010.010.010000000

Cloud cover and precipitation probability

Cloud cover & Rain chance
Time00:0001:0002:0003:0004:0005:0006:0007:0008:0009:0010:0011:0012:0013:0014:0015:0016:0017:0018:0019:0020:0021:0022:0023:00
Cloud cover (%)535664516974858059765174758252885868686855556137
Rain chance (%)1921222024262924161591099595781011141715

Wind speed and direction

Wind & Wind gust
Time00:0001:0002:0003:0004:0005:0006:0007:0008:0009:0010:0011:0012:0013:0014:0015:0016:0017:0018:0019:0020:0021:0022:0023:00
Wind (m/s)1.51.311.191.191.311.191.191.52.112.6121.390.690.610.690.690.310.1911.51.892.3121.31
Wind gust (m/s)2.392.031.861.641.811.691.782.834.115.144.644.224.063.833.613.423.363.083.394.224.675.034.642.61
Wind direction (°)SSE 165°SSE 158°SSE 157°SE 145°SE 145°SE 146°SE 146°SSE 161°S 171°S 178°S 183°S 185°SSE 162°ESE 106°ENE 74°ENE 59°ENE 60°S 179°S 190°S 186°S 186°S 185°S 181°S 169°

Air humidity

Humidity
Time00:0001:0002:0003:0004:0005:0006:0007:0008:0009:0010:0011:0012:0013:0014:0015:0016:0017:0018:0019:0020:0021:0022:0023:00
Humidity (%)909192929393948981736558514744414347556272798386

Atmospheric pressure

Pressure
Time00:0001:0002:0003:0004:0005:0006:0007:0008:0009:0010:0011:0012:0013:0014:0015:0016:0017:0018:0019:0020:0021:0022:0023:00
Pressure (mm Hg)760760759759760760760761761761761761760759758757757757757758758759760760

Ultraviolet index

UV Index
Time00:0001:0002:0003:0004:0005:0006:0007:0008:0009:0010:0011:0012:0013:0014:0015:0016:0017:0018:0019:0020:0021:0022:0023:00
UV Index000000000.82.75.99.311.712.310.77.64.21.60.300000

Air quality & pollen

Air quality
Time00:0001:0002:0003:0004:0005:0006:0007:0008:0009:0010:0011:0012:0013:0014:0015:0016:0017:0018:0019:0020:0021:0022:0023:00
PM2.5 (µg/m³)17.618.520.121.823.725.828.232.129.221.515.411.810.19.18.98.17.97.78.511.71617.918.619.5
PM10 (µg/m³)181920.822.624.626.829.233.230.322.516.112.310.59.59.38.48.27.98.711.916.418.41920
Ozone (O₃) (µg/m³)585450464136374864788895100101100989692877970625652
NO₂ (µg/m³)6.57.28.29.411.513.714.311.67.23.72.11.30.90.70.811.11.323.55.46.97.67.9
SO₂ (µg/m³)1.61.71.81.922.12.22.22.121.71.41.10.90.90.80.70.70.811.41.61.71.7
CO (µg/m³)463492519535538530517503483449388314257232224224228238255279310342378415

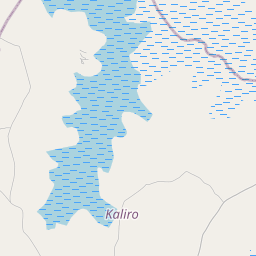
Lwamba on the map

Data Sources & Methodology

Our weather forecasts are powered by a professional weather data provider that aggregates data from national weather services, satellite observations, radar networks, and over 80,000 weather stations worldwide. Forecast data is updated multiple times daily. We convert raw data into clear summaries — wind speed in m/s, pressure in mmHg — so you can plan your day with confidence.