5-day weather forecast Kisangani Nov 14, 2026

33°21° · Patchy rain possible

Weather forecast Kisangani Saturday Nov 14, 2026: patchy rain possible, temperature from 21 °C to 33 °C.

Precipitation probability 69%. Wind up to 2.19 m/s (gusts 5.58 m/s). Air humidity 45–97%, atmospheric pressure 757–763 mm Hg, UV index up to 9.9.

Sunrise 06:00
Sunset 18:06
First Quarter31% illuminated
Moonrise 10:25 · Moonset 22:46
Chart
Table

Forecast from 21 °C to 33 °C and precipitation

Temperature & Precipitation
Time00:0001:0002:0003:0004:0005:0006:0007:0008:0009:0010:0011:0012:0013:0014:0015:0016:0017:0018:0019:0020:0021:0022:0023:00
Temperature (°C)232222222221222324272932333333313231292724242322
Precipitation (mm/hr)0.010.01000.0100000.010.020.040.030.10.020.040.070.110.270.580.690.440.80.23

Cloud cover and precipitation probability

Cloud cover & Rain chance
Time00:0001:0002:0003:0004:0005:0006:0007:0008:0009:0010:0011:0012:0013:0014:0015:0016:0017:0018:0019:0020:0021:0022:0023:00
Cloud cover (%)7880453372100362536768979835661825655585569758890
Rain chance (%)27282523324219151314141110176111717244256546954

Wind speed and direction

Wind & Wind gust
Time00:0001:0002:0003:0004:0005:0006:0007:0008:0009:0010:0011:0012:0013:0014:0015:0016:0017:0018:0019:0020:0021:0022:0023:00
Wind (m/s)111.191.191.111.110.810.690.891.111.311.391.3111.111.190.890.810.611.392.191.611.611
Wind gust (m/s)4.083.252.472.252.031.722.112.943.143.53.754.064.394.534.034.313.813.693.613.895.584.253.53.19
Wind direction (°)SW 215°SW 226°WSW 247°WSW 250°WSW 254°WSW 255°SW 221°SSW 198°S 185°S 186°S 184°S 186°S 188°S 187°S 175°S 173°S 178°SE 143°ENE 61°ENE 73°ENE 77°ENE 68°ENE 60°NE 56°

Air humidity

Humidity
Time00:0001:0002:0003:0004:0005:0006:0007:0008:0009:0010:0011:0012:0013:0014:0015:0016:0017:0018:0019:0020:0021:0022:0023:00
Humidity (%)939495959697949083706051474548534953647488919496

Atmospheric pressure

Pressure
Time00:0001:0002:0003:0004:0005:0006:0007:0008:0009:0010:0011:0012:0013:0014:0015:0016:0017:0018:0019:0020:0021:0022:0023:00
Pressure (mm Hg)761761761761761761762762763763762761761759758758757757758759760761761761

Ultraviolet index

UV Index
Time00:0001:0002:0003:0004:0005:0006:0007:0008:0009:0010:0011:0012:0013:0014:0015:0016:0017:0018:0019:0020:0021:0022:0023:00
UV Index00000000.21.235.88.79.99.35.91.30.70.3000000

Air quality & pollen

Air quality
Time00:0001:0002:0003:0004:0005:0006:0007:0008:0009:0010:0011:0012:0013:0014:0015:0016:0017:0018:0019:0020:0021:0022:0023:00
PM2.5 (µg/m³)25.524.62423.723.222.621.921.722.422.523.225.426.426.626.726.726.926.926.928.128.228.528.527.8
PM10 (µg/m³)36.835.434.834.333.331.83028.630.331.834.138.540.340.640.740.94140.538.839.639.239.238.938
Ozone (O₃) (µg/m³)252423211918171720283846505151514946403226232322
NO₂ (µg/m³)1.41.31.21.21.21.10.90.60.40.30.20.10.10.10.10.10.10.30.81.41.9222
SO₂ (µg/m³)0.40.30.30.30.30.30.30.30.30.30.40.40.40.40.40.40.40.40.40.50.50.50.50.5
CO (µg/m³)206210212209203196188179171163157152151152154157161169184203218227232231

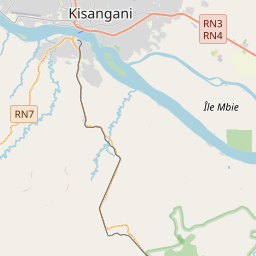
Kisangani on the map

Data Sources & Methodology

Our weather forecasts are powered by a professional weather data provider that aggregates data from national weather services, satellite observations, radar networks, and over 80,000 weather stations worldwide. Forecast data is updated multiple times daily. We convert raw data into clear summaries — wind speed in m/s, pressure in mmHg — so you can plan your day with confidence.