5-day weather forecast Kisangani Nov 13, 2026

32°22° · Patchy rain possible

Weather forecast Kisangani tomorrow Nov 13, 2026: patchy rain possible, temperature from 22 °C to 32 °C.

Precipitation probability 48%. Wind up to 2 m/s (gusts 6.22 m/s). Air humidity 44–92%, atmospheric pressure 758–763 mm Hg, UV index up to 10.4.

Sunrise 06:00
Sunset 18:06
Waxing Crescent22% illuminated
Moonrise 09:34 · Moonset 21:57
Chart
Table

Forecast from 22 °C to 32 °C and precipitation

Temperature & Precipitation
Time00:0001:0002:0003:0004:0005:0006:0007:0008:0009:0010:0011:0012:0013:0014:0015:0016:0017:0018:0019:0020:0021:0022:0023:00
Temperature (°C)232322222222222325283032323129292929272524242323
Precipitation (mm/hr)0000000000000.280.560.850.560.290.030.030.350.330.150.020.02

Cloud cover and precipitation probability

Cloud cover & Rain chance
Time00:0001:0002:0003:0004:0005:0006:0007:0008:0009:0010:0011:0012:0013:0014:0015:0016:0017:0018:0019:0020:0021:0022:0023:00
Cloud cover (%)868185777053363833242118877078545282717787867170
Rain chance (%)21212323232117149532233644362214164248412526

Wind speed and direction

Wind & Wind gust
Time00:0001:0002:0003:0004:0005:0006:0007:0008:0009:0010:0011:0012:0013:0014:0015:0016:0017:0018:0019:0020:0021:0022:0023:00
Wind (m/s)1.611.51.51.391.391.391.311.191.191.311.611.811.8921.891.611.1111.191.110.8111.111.31
Wind gust (m/s)3.3933.112.722.813.032.923.423.53.944.334.6155.726.225.424.694.223.724.033.424.565.035.56
Wind direction (°)SSE 149°SSE 149°SSE 153°SSE 151°SSE 154°SSE 154°SSE 152°SSE 153°SSE 160°S 184°SSW 201°SSW 211°SW 216°SW 217°SW 221°SSW 211°SSW 193°SSE 163°SSE 162°SSE 154°SE 145°S 170°SSW 195°SSW 206°

Air humidity

Humidity
Time00:0001:0002:0003:0004:0005:0006:0007:0008:0009:0010:0011:0012:0013:0014:0015:0016:0017:0018:0019:0020:0021:0022:0023:00
Humidity (%)818385889092898374625344475159626165738288909192

Atmospheric pressure

Pressure
Time00:0001:0002:0003:0004:0005:0006:0007:0008:0009:0010:0011:0012:0013:0014:0015:0016:0017:0018:0019:0020:0021:0022:0023:00
Pressure (mm Hg)761761761761761761761762763763762762761760759758758758758760761761761762

Ultraviolet index

UV Index
Time00:0001:0002:0003:0004:0005:0006:0007:0008:0009:0010:0011:0012:0013:0014:0015:0016:0017:0018:0019:0020:0021:0022:0023:00
UV Index00000000.21.23.36.2910.49.94.50.90.40.2000000

Air quality & pollen

Air quality
Time00:0001:0002:0003:0004:0005:0006:0007:0008:0009:0010:0011:0012:0013:0014:0015:0016:0017:0018:0019:0020:0021:0022:0023:00
PM2.5 (µg/m³)14.413.713.41313.113.11313.313.713.815.420.724.927.131.929.429.828.527.828.628.527.627.126.6
PM10 (µg/m³)19.918.918.517.817.91817.517.618.919.623.63441.845.553.649.449.444.541.342.141.34039.138.4
Ozone (O₃) (µg/m³)212019191920202123293744495455524539342925242525
NO₂ (µg/m³)1.61.41.31.110.80.70.60.50.40.20.10.10.10.10.20.30.511.51.91.91.71.5
SO₂ (µg/m³)0.40.30.30.30.20.20.20.20.20.30.30.40.40.40.40.40.30.30.30.40.40.40.40.4
CO (µg/m³)158155154154156157158159159158156154153152153156160164166166170179190199

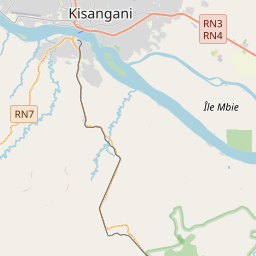
Kisangani on the map

Data Sources & Methodology

Our weather forecasts are powered by a professional weather data provider that aggregates data from national weather services, satellite observations, radar networks, and over 80,000 weather stations worldwide. Forecast data is updated multiple times daily. We convert raw data into clear summaries — wind speed in m/s, pressure in mmHg — so you can plan your day with confidence.