5-day weather forecast Hyderabad Nov 18, 2026

30°19° · Cloudy

Weather forecast Hyderabad Wednesday Nov 18, 2026: cloudy, temperature from 19 °C to 30 °C.

Precipitation probability 15%. Wind up to 5.11 m/s (gusts 8.83 m/s). Air humidity 34–69%, atmospheric pressure 760–763 mm Hg, UV index up to 7.7.

Sunrise 06:22
Sunset 17:39
Waxing Gibbous73% illuminated
Moonrise 13:17 · Moonset 00:34
Chart
Table

Forecast from 19 °C to 30 °C and precipitation

Temperature & Precipitation
Time00:0001:0002:0003:0004:0005:0006:0007:0008:0009:0010:0011:0012:0013:0014:0015:0016:0017:0018:0019:0020:0021:0022:0023:00
Temperature (°C)202020191919202224252729293030292826252423222221
Precipitation (mm/hr)000000000000000000000000

Cloud cover and precipitation probability

Cloud cover & Rain chance
Time00:0001:0002:0003:0004:0005:0006:0007:0008:0009:0010:0011:0012:0013:0014:0015:0016:0017:0018:0019:0020:0021:0022:0023:00
Cloud cover (%)797858648888638794926074826655292939656375839696
Rain chance (%)111191015151113121056754223679101212

Wind speed and direction

Wind & Wind gust
Time00:0001:0002:0003:0004:0005:0006:0007:0008:0009:0010:0011:0012:0013:0014:0015:0016:0017:0018:0019:0020:0021:0022:0023:00
Wind (m/s)1.811.811.811.811.691.691.691.892.613.314.315.115.1155.114.894.6943.693.312.892.8133.19
Wind gust (m/s)3.223.113.173.2532.6733.895.116.647.818.838.758.588.588.197.898.147.896.895.445.085.696.5
Wind direction (°)ENE 62°ENE 58°ENE 62°ENE 62°NE 53°NNE 31°NE 39°NE 45°ENE 57°NE 55°NE 53°NE 50°NE 48°NE 48°NE 47°NE 47°NE 44°NE 46°NE 46°NE 44°NE 38°NNE 28°NNE 25°NNE 19°

Air humidity

Humidity
Time00:0001:0002:0003:0004:0005:0006:0007:0008:0009:0010:0011:0012:0013:0014:0015:0016:0017:0018:0019:0020:0021:0022:0023:00
Humidity (%)606163656769676256504439373634363842475155555554

Atmospheric pressure

Pressure
Time00:0001:0002:0003:0004:0005:0006:0007:0008:0009:0010:0011:0012:0013:0014:0015:0016:0017:0018:0019:0020:0021:0022:0023:00
Pressure (mm Hg)761761761761761761761762763763762762761761760760760761761762762762762762

Ultraviolet index

UV Index
Time00:0001:0002:0003:0004:0005:0006:0007:0008:0009:0010:0011:0012:0013:0014:0015:0016:0017:0018:0019:0020:0021:0022:0023:00
UV Index00000000.31.22.95.57.27.76.24.12.10.70000000

Air quality & pollen

Air quality
Time00:0001:0002:0003:0004:0005:0006:0007:0008:0009:0010:0011:0012:0013:0014:0015:0016:0017:0018:0019:0020:0021:0022:0023:00
PM2.5 (µg/m³)36.636.336.637.138.54144.447.348.148.844.8413835.734.534.134.836.840.242.844.645.545.143.1
PM10 (µg/m³)40.240.340.741.442.644.647.650.251.553.349.745.642.139.738.137.63839.342.444.946.747.647.145.2
Ozone (O₃) (µg/m³)8381808184889399108124144157160156151145138131123114108105103103
NO₂ (µg/m³)13.511.49.88.67.87.89.712.313.210.35.72.21.21.42.33.868.310.813.314.814.813.712.3
SO₂ (µg/m³)15.916.517.519.321.62323.222.621.620.318.616.814.91311.6111111.713.315.517.619.220.621.8
CO (µg/m³)397338298289299336434559615536388278250260280309349376380372361351339327

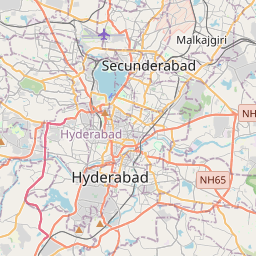
Hyderabad on the map

Data Sources & Methodology

Our weather forecasts are powered by a professional weather data provider that aggregates data from national weather services, satellite observations, radar networks, and over 80,000 weather stations worldwide. Forecast data is updated multiple times daily. We convert raw data into clear summaries — wind speed in m/s, pressure in mmHg — so you can plan your day with confidence.