5-day weather forecast Hyderabad Nov 17, 2026

30°18° · Smoky haze

Weather forecast Hyderabad tomorrow Nov 17, 2026: smoky haze, temperature from 18 °C to 30 °C.

Precipitation probability 10%. Wind up to 4.31 m/s (gusts 7.72 m/s). Air humidity 27–60%, atmospheric pressure 758–761 mm Hg, UV index up to 7.9.

Sunrise 06:21
Sunset 17:39
First Quarter63% illuminated
Moonrise 12:44 · Moonset does not set today
Chart
Table

Forecast from 18 °C to 30 °C and precipitation

Temperature & Precipitation
Time00:0001:0002:0003:0004:0005:0006:0007:0008:0009:0010:0011:0012:0013:0014:0015:0016:0017:0018:0019:0020:0021:0022:0023:00
Temperature (°C)201919191918202224262829303030292826252422222121
Precipitation (mm/hr)000000000000000000000000

Cloud cover and precipitation probability

Cloud cover & Rain chance
Time00:0001:0002:0003:0004:0005:0006:0007:0008:0009:0010:0011:0012:0013:0014:0015:0016:0017:0018:0019:0020:0021:0022:0023:00
Cloud cover (%)627078585747234219667193981392534316880777756
Rain chance (%)89108874521111373223799107

Wind speed and direction

Wind & Wind gust
Time00:0001:0002:0003:0004:0005:0006:0007:0008:0009:0010:0011:0012:0013:0014:0015:0016:0017:0018:0019:0020:0021:0022:0023:00
Wind (m/s)1.3110.8110.890.811.111.391.892.813.54.114.194.194.314.1143.693.393.312.892.392.192.11
Wind gust (m/s)2.441.921.361.531.361.311.862.973.945.366.57.367.337.257.337.036.897.727.57.316.114.533.923.78
Wind direction (°)NE 35°NNE 28°NNE 23°NNE 12°NNE 19°NNE 31°NNE 15°NNE 21°NNE 22°NNE 31°NE 40°NE 45°NE 48°NE 52°NE 56°NE 54°NE 53°NE 55°NE 56°ENE 60°ENE 65°ENE 65°ENE 64°ENE 61°

Air humidity

Humidity
Time00:0001:0002:0003:0004:0005:0006:0007:0008:0009:0010:0011:0012:0013:0014:0015:0016:0017:0018:0019:0020:0021:0022:0023:00
Humidity (%)585858595960575245403530282727293237434752545658

Atmospheric pressure

Pressure
Time00:0001:0002:0003:0004:0005:0006:0007:0008:0009:0010:0011:0012:0013:0014:0015:0016:0017:0018:0019:0020:0021:0022:0023:00
Pressure (mm Hg)760760759759760760761761761761761761760759758758759759760761761761761761

Ultraviolet index

UV Index
Time00:0001:0002:0003:0004:0005:0006:0007:0008:0009:0010:0011:0012:0013:0014:0015:0016:0017:0018:0019:0020:0021:0022:0023:00
UV Index00000000.31.43.45.87.57.96.84.52.30.80000000

Air quality & pollen

Air quality
Time00:0001:0002:0003:0004:0005:0006:0007:0008:0009:0010:0011:0012:0013:0014:0015:0016:0017:0018:0019:0020:0021:0022:0023:00
PM2.5 (µg/m³)56.553.350.949.449.150.857.563.649.939.235.734.332.931.931.130.730.931.834.236.237.438.238.437.5
PM10 (µg/m³)63.660.357.756.256.25865.27156.547.143.24138.937.135.935.2353537.339.140.341.241.640.9
Ozone (O₃) (µg/m³)949798959189919510412114115616115915514813712611510394898785
NO₂ (µg/m³)16.713.411.210.811.412.715.719.420.215.582.40.91.32.43.85.98.21114.116.116.61615
SO₂ (µg/m³)21.521.521.722.423.324.32627.727.62418.614.312.411.711.110.39.89.810.812.413.714.414.815.3
CO (µg/m³)505420362347360402512652707594396250218238266292326351354347350379418432

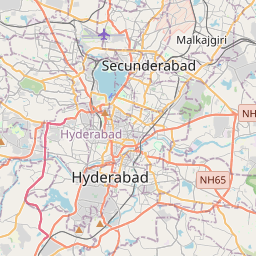
Hyderabad on the map

Data Sources & Methodology

Our weather forecasts are powered by a professional weather data provider that aggregates data from national weather services, satellite observations, radar networks, and over 80,000 weather stations worldwide. Forecast data is updated multiple times daily. We convert raw data into clear summaries — wind speed in m/s, pressure in mmHg — so you can plan your day with confidence.