5-day weather forecast Hoorn Nov 20, 2026

7°4° · Patchy rain possible

Weather forecast Hoorn Friday Nov 20, 2026: patchy rain possible, temperature from 4 °C to 7 °C.

Precipitation probability 49%. Wind up to 3.81 m/s (gusts 6.69 m/s). Air humidity 82–94%, atmospheric pressure 746–757 mm Hg, UV index up to 0.3.

5 days at a glance — tap a day to open it
Sunrise 08:11
Sunset 16:39
Waxing Gibbous89% illuminated
Moonrise 14:31 · Moonset 02:55
Chart
Table

Forecast from 4 °C to 7 °C and precipitation

Temperature & Precipitation
Time00:0001:0002:0003:0004:0005:0006:0007:0008:0009:0010:0011:0012:0013:0014:0015:0016:0017:0018:0019:0020:0021:0022:0023:00
Temperature (°C)766555555556666666554444
Precipitation (mm/hr)0.150.10.060.070.110.040.120.070.01000.010.010000000000.040.03

Cloud cover and precipitation probability

Cloud cover & Rain chance
Time00:0001:0002:0003:0004:0005:0006:0007:0008:0009:0010:0011:0012:0013:0014:0015:0016:0017:0018:0019:0020:0021:0022:0023:00
Cloud cover (%)90868481808183848076717985939173613622910107570
Rain chance (%)493934343831393628262526262625201814121112122623

Wind speed and direction

Wind & Wind gust
Time00:0001:0002:0003:0004:0005:0006:0007:0008:0009:0010:0011:0012:0013:0014:0015:0016:0017:0018:0019:0020:0021:0022:0023:00
Wind (m/s)3.193.193.313.1133.113.193.193.393.53.613.693.693.693.693.813.813.393.112.612.111.812.112.19
Wind gust (m/s)5.945.975.615.084.474.695.035.225.565.725.896.176.476.536.616.616.696.566.255.54.723.583.724.19
Wind direction (°)ENE 68°ENE 73°ENE 76°E 79°E 81°E 83°E 86°E 92°E 92°E 92°E 92°E 86°E 82°E 79°ENE 68°ENE 60°NE 52°NE 45°NE 38°NNE 30°NNE 15°NNW 345°NW 318°NW 321°

Air humidity

Humidity
Time00:0001:0002:0003:0004:0005:0006:0007:0008:0009:0010:0011:0012:0013:0014:0015:0016:0017:0018:0019:0020:0021:0022:0023:00
Humidity (%)939393939493939393929290888585848382828384858685

Atmospheric pressure

Pressure
Time00:0001:0002:0003:0004:0005:0006:0007:0008:0009:0010:0011:0012:0013:0014:0015:0016:0017:0018:0019:0020:0021:0022:0023:00
Pressure (mm Hg)746746746747748748749749749750750751751752752752752753754754755755756757

Ultraviolet index

UV Index
Time00:0001:0002:0003:0004:0005:0006:0007:0008:0009:0010:0011:0012:0013:0014:0015:0016:0017:0018:0019:0020:0021:0022:0023:00
UV Index00000000000.10.20.20.30.30.300000000

Air quality & pollen

Air quality
Time00:0001:0002:0003:0004:0005:0006:0007:0008:0009:0010:0011:0012:0013:0014:0015:0016:0017:0018:0019:0020:0021:0022:0023:00
PM2.5 (µg/m³)4.23.74.24.95.45.35.14.955.36.35.95.44.94.64.4444.14.54.44.54.96.3
PM10 (µg/m³)5.95.865.86.36.26.166.37.47.67.676.45.85.65.45.46.16.26.266.48.6
Ozone (O₃) (µg/m³)444543434747474846353542515353535349494745474551
NO₂ (µg/m³)8.57.87.37.16.56.66.87.39.110.810.39.58.48.48.711.41314.617.41814.914.415.813.5
SO₂ (µg/m³)0.40.40.40.40.40.40.40.40.40.50.50.50.50.50.60.60.50.50.50.50.40.40.30.4
CO (µg/m³)169167164161160157158163172177175172171169169176183186189190189181177186.3

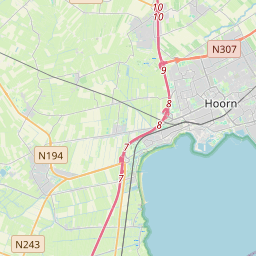
Hoorn on the map

Data Sources & Methodology

Our weather forecasts are powered by a professional weather data provider that aggregates data from national weather services, satellite observations, radar networks, and over 80,000 weather stations worldwide. Forecast data is updated multiple times daily. We convert raw data into clear summaries — wind speed in m/s, pressure in mmHg — so you can plan your day with confidence.