5-day weather forecast Hoorn Oct 30, 2026

14°9° · Sunny

Weather forecast Hoorn tomorrow Oct 30, 2026: sunny, temperature from 9 °C to 14 °C.

Precipitation probability 39%. Wind up to 3.19 m/s (gusts 6.89 m/s). Air humidity 70–97%, atmospheric pressure 773–775 mm Hg, UV index up to 1.3.

Sunrise 07:32
Sunset 17:13
Waning Gibbous71% illuminated
Moonrise 19:35 · Moonset 13:00
Chart
Table

Forecast from 9 °C to 14 °C and precipitation

Temperature & Precipitation
Time00:0001:0002:0003:0004:0005:0006:0007:0008:0009:0010:0011:0012:0013:0014:0015:0016:0017:0018:0019:0020:0021:0022:0023:00
Temperature (°C)1010109109999101113141314141311111111111010
Precipitation (mm/hr)000000000000000000000000

Cloud cover and precipitation probability

Cloud cover & Rain chance
Time00:0001:0002:0003:0004:0005:0006:0007:0008:0009:0010:0011:0012:0013:0014:0015:0016:0017:0018:0019:0020:0021:0022:0023:00
Cloud cover (%)06001624851001004797431660109195544755135
Rain chance (%)142914152925203938203113815661011131824141615

Wind speed and direction

Wind & Wind gust
Time00:0001:0002:0003:0004:0005:0006:0007:0008:0009:0010:0011:0012:0013:0014:0015:0016:0017:0018:0019:0020:0021:0022:0023:00
Wind (m/s)1.891.111.6921.191.691.51.391.51.892.312.52.612.612.812.612.392.312.532.692.813.193
Wind gust (m/s)6.891.691.8122.171.691.612.641.532.424.223.423.314.443.333.223.972.312.54.112.692.894.423.39
Wind direction (°)SE 132°ESE 119°SE 130°SE 133°ESE 123°SSE 159°SSE 165°ESE 115°SE 145°SE 132°SE 137°SE 141°SE 136°ESE 115°ESE 123°ESE 110°ENE 76°ENE 71°ENE 72°ENE 67°ENE 75°E 85°E 85°E 97°

Air humidity

Humidity
Time00:0001:0002:0003:0004:0005:0006:0007:0008:0009:0010:0011:0012:0013:0014:0015:0016:0017:0018:0019:0020:0021:0022:0023:00
Humidity (%)929792939694959795929380747970717984889090919392

Atmospheric pressure

Pressure
Time00:0001:0002:0003:0004:0005:0006:0007:0008:0009:0010:0011:0012:0013:0014:0015:0016:0017:0018:0019:0020:0021:0022:0023:00
Pressure (mm Hg)773773773773773773773773773774774773773774773773773773773774774774775774

Ultraviolet index

UV Index
Time00:0001:0002:0003:0004:0005:0006:0007:0008:0009:0010:0011:0012:0013:0014:0015:0016:0017:0018:0019:0020:0021:0022:0023:00
UV Index0000000000.20.50.91.21.31.10.70.30000000

Air quality & pollen

Air quality
Time00:0001:0002:0003:0004:0005:0006:0007:0008:0009:0010:0011:0012:0013:0014:0015:0016:0017:0018:0019:0020:0021:0022:0023:00
PM2.5 (µg/m³)20.721.52222.923.724.725.224.924.227.1272725.925.428.428.625.824.623.122.521.319.920.422.3
PM10 (µg/m³)24.225.226.227.227.426.826.526.826.530.529.63029.629.533.13329.728.226.525.824.222.723.325.6
Ozone (O₃) (µg/m³)201815121213161920202227303234353939384143464639
NO₂ (µg/m³)3737.236.837.533.628.927.725.124.127.720.919.617.416.41616.116.717.81919.717141313.2
SO₂ (µg/m³)0.50.60.60.60.70.60.40.30.40.40.40.40.40.50.60.70.90.80.80.70.70.60.60.8
CO (µg/m³)242238234229219215207211217230227224231234239245244234229226210204208204

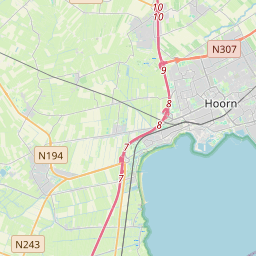
Hoorn on the map

Data Sources & Methodology

Our weather forecasts are powered by a professional weather data provider that aggregates data from national weather services, satellite observations, radar networks, and over 80,000 weather stations worldwide. Forecast data is updated multiple times daily. We convert raw data into clear summaries — wind speed in m/s, pressure in mmHg — so you can plan your day with confidence.