5-day weather forecast Guaíra Nov 14, 2026

32°22° · Partly cloudy

Weather forecast Guaíra Saturday Nov 14, 2026: partly cloudy, temperature from 22 °C to 32 °C.

Precipitation probability 62%. Wind up to 3.31 m/s (gusts 6.81 m/s). Air humidity 56–94%, atmospheric pressure 755–760 mm Hg, UV index up to 13.3.

Sunrise 05:43
Sunset 18:59
First Quarter31% illuminated
Moonrise 10:06 · Moonset 23:57
Chart
Table

Forecast from 22 °C to 32 °C and precipitation

Temperature & Precipitation
Time00:0001:0002:0003:0004:0005:0006:0007:0008:0009:0010:0011:0012:0013:0014:0015:0016:0017:0018:0019:0020:0021:0022:0023:00
Temperature (°C)242323232222222426272930313232323030292726252423
Precipitation (mm/hr)00000000000.020.030.050.030.020.080.050.050.070.040.020.050.520.19

Cloud cover and precipitation probability

Cloud cover & Rain chance
Time00:0001:0002:0003:0004:0005:0006:0007:0008:0009:0010:0011:0012:0013:0014:0015:0016:0017:0018:0019:0020:0021:0022:0023:00
Cloud cover (%)41541362852393833147277597080898374989597969899
Rain chance (%)12141818172018161281414111111181715262626306247

Wind speed and direction

Wind & Wind gust
Time00:0001:0002:0003:0004:0005:0006:0007:0008:0009:0010:0011:0012:0013:0014:0015:0016:0017:0018:0019:0020:0021:0022:0023:00
Wind (m/s)0.810.890.811.311.391.6922.3933.313.192.892.51.891.390.610.310.390.810.690.610.612.111.11
Wind gust (m/s)1.581.781.691.812.062.563.565.586.226.646.816.446.175.564.924.473.893.473.333.032.222.894.563.67
Wind direction (°)E 96°E 84°ENE 65°NNE 27°NE 41°NE 52°NE 54°ENE 59°NE 53°NE 53°NE 39°NNE 30°NNE 15°NNE 16°NNE 15°N 11°NNE 21°SE 145°SSE 161°ESE 122°SE 140°E 101°S 180°S 190°

Air humidity

Humidity
Time00:0001:0002:0003:0004:0005:0006:0007:0008:0009:0010:0011:0012:0013:0014:0015:0016:0017:0018:0019:0020:0021:0022:0023:00
Humidity (%)878890929292928881756965605856596768757982859194

Atmospheric pressure

Pressure
Time00:0001:0002:0003:0004:0005:0006:0007:0008:0009:0010:0011:0012:0013:0014:0015:0016:0017:0018:0019:0020:0021:0022:0023:00
Pressure (mm Hg)759759758758758758759759760760759759759758758757756756755755756757757758

Ultraviolet index

UV Index
Time00:0001:0002:0003:0004:0005:0006:0007:0008:0009:0010:0011:0012:0013:0014:0015:0016:0017:0018:0019:0020:0021:0022:0023:00
UV Index00000000.41.547.410.91313.311.58.22.20.60.300000

Air quality & pollen

Air quality
Time00:0001:0002:0003:0004:0005:0006:0007:0008:0009:0010:0011:0012:0013:0014:0015:0016:0017:0018:0019:0020:0021:0022:0023:00
PM2.5 (µg/m³)20.822.521.217.816.517.117.616.617.71513.211.110.39.68.98.58.17.98.210.612.612.813.414.6
PM10 (µg/m³)21.523.221.918.317.117.718.317.218.315.413.411.210.49.79.18.68.38.18.410.812.913.213.915.3
Ozone (O₃) (µg/m³)474544434036395474921031101151171171151121071008976666260
NO₂ (µg/m³)19.118.617.316.115.715.514.311.16.93.62.11.51.10.80.811.21.62.64.67.19.110.311.1
SO₂ (µg/m³)1.61.61.51.41.31.31.21.11.110.90.70.60.50.40.40.40.40.40.50.70.811.1
CO (µg/m³)464469464455440421413430457464433383339309285273269276312394504607695776

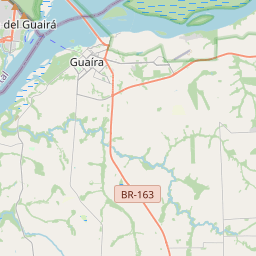
Guaíra on the map

Data Sources & Methodology

Our weather forecasts are powered by a professional weather data provider that aggregates data from national weather services, satellite observations, radar networks, and over 80,000 weather stations worldwide. Forecast data is updated multiple times daily. We convert raw data into clear summaries — wind speed in m/s, pressure in mmHg — so you can plan your day with confidence.