5-day weather forecast Guaíra Nov 13, 2026

32°21° · Patchy rain possible

Weather forecast Guaíra tomorrow Nov 13, 2026: patchy rain possible, temperature from 21 °C to 32 °C.

Precipitation probability 25%. Wind up to 1.81 m/s (gusts 4.53 m/s). Air humidity 56–96%, atmospheric pressure 758–761 mm Hg, UV index up to 13.

Sunrise 05:43
Sunset 18:58
Waxing Crescent22% illuminated
Moonrise 09:10 · Moonset 23:16
Chart
Table

Forecast from 21 °C to 32 °C and precipitation

Temperature & Precipitation
Time00:0001:0002:0003:0004:0005:0006:0007:0008:0009:0010:0011:0012:0013:0014:0015:0016:0017:0018:0019:0020:0021:0022:0023:00
Temperature (°C)232322222222212325272930313232323231292726252524
Precipitation (mm/hr)00000000000.010.020.030.030.030.030.020.01000000

Cloud cover and precipitation probability

Cloud cover & Rain chance
Time00:0001:0002:0003:0004:0005:0006:0007:0008:0009:0010:0011:0012:0013:0014:0015:0016:0017:0018:0019:0020:0021:0022:0023:00
Cloud cover (%)4342414040404034207988768073808978503418333
Rain chance (%)242020242425251710714151212111213121010991011

Wind speed and direction

Wind & Wind gust
Time00:0001:0002:0003:0004:0005:0006:0007:0008:0009:0010:0011:0012:0013:0014:0015:0016:0017:0018:0019:0020:0021:0022:0023:00
Wind (m/s)1.111.191.111.111.191.111.311.311.611.811.39110.50.69111.391.51.51.311.111.111
Wind gust (m/s)21.921.921.941.921.831.892.943.444.143.973.723.723.814.144.534.224.083.863.032.692.442.171.97
Wind direction (°)ESE 102°E 88°E 93°E 88°E 90°E 90°E 80°ENE 76°ENE 67°NE 54°NE 45°NNE 26°N 349°NW 310°SW 227°SSW 204°S 175°SSE 151°SE 144°SE 144°SE 135°ESE 118°ESE 114°ESE 107°

Air humidity

Humidity
Time00:0001:0002:0003:0004:0005:0006:0007:0008:0009:0010:0011:0012:0013:0014:0015:0016:0017:0018:0019:0020:0021:0022:0023:00
Humidity (%)949494949595969083757066625958565964717578818385

Atmospheric pressure

Pressure
Time00:0001:0002:0003:0004:0005:0006:0007:0008:0009:0010:0011:0012:0013:0014:0015:0016:0017:0018:0019:0020:0021:0022:0023:00
Pressure (mm Hg)761761760760760761761761761761761761761760759758758758758758758758758759

Ultraviolet index

UV Index
Time00:0001:0002:0003:0004:0005:0006:0007:0008:0009:0010:0011:0012:0013:0014:0015:0016:0017:0018:0019:0020:0021:0022:0023:00
UV Index00000000.41.74.27.510.712.81311.48.44.720.600000

Air quality & pollen

Air quality
Time00:0001:0002:0003:0004:0005:0006:0007:0008:0009:0010:0011:0012:0013:0014:0015:0016:0017:0018:0019:0020:0021:0022:0023:00
PM2.5 (µg/m³)9.49.39.811.312.112.912.511.195.65.24.84.74.74.64.44.24.44.87.610.713.215.418
PM10 (µg/m³)9.89.710.311.412.21312.511.195.65.24.84.84.74.64.54.34.44.97.610.913.715.918.6
Ozone (O₃) (µg/m³)403735343434384760718088949799999998938267565149
NO₂ (µg/m³)11.911.511.210.79.78.475.542.71.91.410.80.80.90.80.92.25.710.314.216.718.3
SO₂ (µg/m³)0.70.60.60.50.40.40.30.30.20.20.20.20.20.20.20.20.20.10.20.40.60.91.21.4
CO (µg/m³)588581534492475463446418385350313275245225212210220241269306349388420447

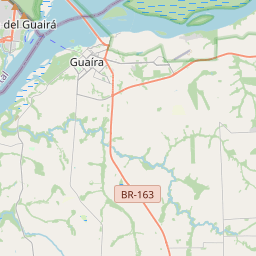
Guaíra on the map

Data Sources & Methodology

Our weather forecasts are powered by a professional weather data provider that aggregates data from national weather services, satellite observations, radar networks, and over 80,000 weather stations worldwide. Forecast data is updated multiple times daily. We convert raw data into clear summaries — wind speed in m/s, pressure in mmHg — so you can plan your day with confidence.