5-day weather forecast Durban Nov 18, 2026

22°15° · Partly cloudy

Weather forecast Durban Wednesday Nov 18, 2026: partly cloudy, temperature from 15 °C to 22 °C.

Precipitation probability 19%. Wind up to 3.81 m/s (gusts 7.14 m/s). Air humidity 61–83%, atmospheric pressure 764–767 mm Hg, UV index up to 7.

Sunrise 04:50
Sunset 18:31
Waxing Gibbous73% illuminated
Moonrise 12:39 · Moonset 00:54
Chart
Table

Forecast from 15 °C to 22 °C and precipitation

Temperature & Precipitation
Time00:0001:0002:0003:0004:0005:0006:0007:0008:0009:0010:0011:0012:0013:0014:0015:0016:0017:0018:0019:0020:0021:0022:0023:00
Temperature (°C)181717161615182021212222222222222121212020191919
Precipitation (mm/hr)0.01000000000.010.020.020.010.010000000000

Cloud cover and precipitation probability

Cloud cover & Rain chance
Time00:0001:0002:0003:0004:0005:0006:0007:0008:0009:0010:0011:0012:0013:0014:0015:0016:0017:0018:0019:0020:0021:0022:0023:00
Cloud cover (%)686254241111233238896187796742484656667278756954
Rain chance (%)191715111111108613101413107889121316161513

Wind speed and direction

Wind & Wind gust
Time00:0001:0002:0003:0004:0005:0006:0007:0008:0009:0010:0011:0012:0013:0014:0015:0016:0017:0018:0019:0020:0021:0022:0023:00
Wind (m/s)2.892.812.692.612.52.391.891.3911.312.313.113.193.393.53.693.813.613.192.692.52.392.312.39
Wind gust (m/s)5.194.924.674.424.113.923.923.583.424.084.785.616.116.647.147.067.086.756.365.674.924.364.144.33
Wind direction (°)WSW 241°WSW 248°WSW 253°WSW 256°W 260°W 270°W 268°WSW 249°SSW 199°SE 127°ESE 103°E 93°E 88°E 83°E 80°ENE 75°ENE 69°ENE 67°ENE 57°NE 44°NNE 27°NNE 21°NNE 15°N 6°

Air humidity

Humidity
Time00:0001:0002:0003:0004:0005:0006:0007:0008:0009:0010:0011:0012:0013:0014:0015:0016:0017:0018:0019:0020:0021:0022:0023:00
Humidity (%)818180818283776862626162636364646566697174757677

Atmospheric pressure

Pressure
Time00:0001:0002:0003:0004:0005:0006:0007:0008:0009:0010:0011:0012:0013:0014:0015:0016:0017:0018:0019:0020:0021:0022:0023:00
Pressure (mm Hg)767767767767767767767767767767767766765765764764764764764764764764764764

Ultraviolet index

UV Index
Time00:0001:0002:0003:0004:0005:0006:0007:0008:0009:0010:0011:0012:0013:0014:0015:0016:0017:0018:0019:0020:0021:0022:0023:00
UV Index0000000.10.51.23.16.876.85.96.84.12.61.10.200000

Air quality & pollen

Air quality
Time00:0001:0002:0003:0004:0005:0006:0007:0008:0009:0010:0011:0012:0013:0014:0015:0016:0017:0018:0019:0020:0021:0022:0023:00
PM2.5 (µg/m³)10.19.79.59.39.39.29.49.19.19.59.710.410109.89.59.810.310.711.111.412.112.912.5
PM10 (µg/m³)16.916.215.815.515.415.115.414.614.51515.316.315.715.715.815.716.417.31818.6192021.220.4
Ozone (O₃) (µg/m³)525151505050515254586265666563595551494949495051
NO₂ (µg/m³)1.11.11.11.21.21.31.41.41.41.31.10.90.80.80.80.91.11.31.51.61.81.92.12.1
SO₂ (µg/m³)1.61.51.51.61.71.92.32.83.23.43.53.53.32.92.62.21.91.71.82.12.32.52.72.8
CO (µg/m³)3753133104476447426454492862031531191011001019898107134169194195185180

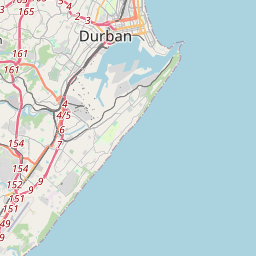
Durban on the map

Data Sources & Methodology

Our weather forecasts are powered by a professional weather data provider that aggregates data from national weather services, satellite observations, radar networks, and over 80,000 weather stations worldwide. Forecast data is updated multiple times daily. We convert raw data into clear summaries — wind speed in m/s, pressure in mmHg — so you can plan your day with confidence.