5-day weather forecast Durban Nov 17, 2026

23°17° · Patchy rain possible

Weather forecast Durban tomorrow Nov 17, 2026: patchy rain possible, temperature from 17 °C to 23 °C.

Precipitation probability 36%. Wind up to 7.11 m/s (gusts 12.19 m/s). Air humidity 61–81%, atmospheric pressure 766–768 mm Hg, UV index up to 11.6.

Sunrise 04:50
Sunset 18:30
First Quarter63% illuminated
Moonrise 11:45 · Moonset 00:25
Chart
Table

Forecast from 17 °C to 23 °C and precipitation

Temperature & Precipitation
Time00:0001:0002:0003:0004:0005:0006:0007:0008:0009:0010:0011:0012:0013:0014:0015:0016:0017:0018:0019:0020:0021:0022:0023:00
Temperature (°C)191918181817192021222223232222212121202019191818
Precipitation (mm/hr)00000.0200.01000.10.190.280.290.30.370.260.180.080.060.040.030.050.050.04

Cloud cover and precipitation probability

Cloud cover & Rain chance
Time00:0001:0002:0003:0004:0005:0006:0007:0008:0009:0010:0011:0012:0013:0014:0015:0016:0017:0018:0019:0020:0021:0022:0023:00
Cloud cover (%)271387747873210747473898859585668737884817875
Rain chance (%)88991891975172125303636232018181921222322

Wind speed and direction

Wind & Wind gust
Time00:0001:0002:0003:0004:0005:0006:0007:0008:0009:0010:0011:0012:0013:0014:0015:0016:0017:0018:0019:0020:0021:0022:0023:00
Wind (m/s)5.6154.313.813.533.114.114.3955.896.616.897.116.695.815.695.314.814.313.813.393.113
Wind gust (m/s)11.6110.729.428.287.396.117.728.819.089.2210.1911.3611.6712.1912.0310.9710.5810.199.618.587.476.836.115.44
Wind direction (°)SW 216°SW 220°SW 225°SW 229°SW 231°WSW 238°SW 229°SSW 213°SSW 208°SSW 193°S 184°S 184°S 178°S 178°S 172°S 172°S 173°S 176°S 183°S 190°SSW 200°SSW 211°SW 224°WSW 237°

Air humidity

Humidity
Time00:0001:0002:0003:0004:0005:0006:0007:0008:0009:0010:0011:0012:0013:0014:0015:0016:0017:0018:0019:0020:0021:0022:0023:00
Humidity (%)717377787878746865626161626568686970727376787981

Atmospheric pressure

Pressure
Time00:0001:0002:0003:0004:0005:0006:0007:0008:0009:0010:0011:0012:0013:0014:0015:0016:0017:0018:0019:0020:0021:0022:0023:00
Pressure (mm Hg)766766766766766767767767767767767767767767767767767767767767767767768768

Ultraviolet index

UV Index
Time00:0001:0002:0003:0004:0005:0006:0007:0008:0009:0010:0011:0012:0013:0014:0015:0016:0017:0018:0019:0020:0021:0022:0023:00
UV Index0000000.31.33.46.39.411.611.411.48.64.61.90.70.200000

Air quality & pollen

Air quality
Time00:0001:0002:0003:0004:0005:0006:0007:0008:0009:0010:0011:0012:0013:0014:0015:0016:0017:0018:0019:0020:0021:0022:0023:00
PM2.5 (µg/m³)6.67.27.276.76.25.55.14.85.46.17.18.29.210.210.711.311.711.811.811.31110.910.4
PM10 (µg/m³)10.91212.211.711.110.39.18.37.78.79.911.613.415.316.917.918.919.619.819.819.218.518.217.5
Ozone (O₃) (µg/m³)545555555555555454555758595959595857565655545352
NO₂ (µg/m³)1.21.11.11.21.31.31.31.21.10.90.70.60.60.60.60.70.80.90.90.80.80.911.1
SO₂ (µg/m³)1.31.31.31.31.41.51.722.22.121.81.71.61.51.51.41.41.41.31.31.41.51.6
CO (µg/m³)13512912913715016016416416014913412111310710410099118173248313362400415

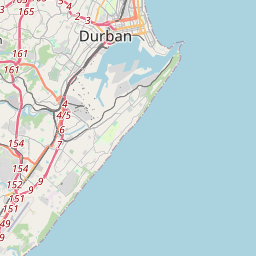
Durban on the map

Data Sources & Methodology

Our weather forecasts are powered by a professional weather data provider that aggregates data from national weather services, satellite observations, radar networks, and over 80,000 weather stations worldwide. Forecast data is updated multiple times daily. We convert raw data into clear summaries — wind speed in m/s, pressure in mmHg — so you can plan your day with confidence.