5-day weather forecast Bundaberg Nov 14, 2026

27°22° · Patchy rain possible

Weather forecast Bundaberg Saturday Nov 14, 2026: patchy rain possible, temperature from 22 °C to 27 °C.

Precipitation probability 65%. Wind up to 4.81 m/s (gusts 9.81 m/s). Air humidity 65–91%, atmospheric pressure 759–763 mm Hg, UV index up to 6.8.

Sunrise 04:55
Sunset 18:14
First Quarter31% illuminated
Moonrise 08:45 · Moonset 22:50
Chart
Table

Forecast from 22 °C to 27 °C and precipitation

Temperature & Precipitation
Time00:0001:0002:0003:0004:0005:0006:0007:0008:0009:0010:0011:0012:0013:0014:0015:0016:0017:0018:0019:0020:0021:0022:0023:00
Temperature (°C)232222222222222223242526272726252525242423232222
Precipitation (mm/hr)0.020.030.070.120.170.240.870.840.260.150.060.160.190.160.170.110.030.070.010.010.050.090.130.12

Cloud cover and precipitation probability

Cloud cover & Rain chance
Time00:0001:0002:0003:0004:0005:0006:0007:0008:0009:0010:0011:0012:0013:0014:0015:0016:0017:0018:0019:0020:0021:0022:0023:00
Cloud cover (%)949994908482787580869189868388939796919489658189
Rain chance (%)273033364342656546312231252326262126212227273537

Wind speed and direction

Wind & Wind gust
Time00:0001:0002:0003:0004:0005:0006:0007:0008:0009:0010:0011:0012:0013:0014:0015:0016:0017:0018:0019:0020:0021:0022:0023:00
Wind (m/s)1.691.611.892.112.192.312.192.192.813.544.394.694.814.814.694.54.193.893.693.53.393.393.5
Wind gust (m/s)3.643.363.333.674.145.035.725.616.617.568.398.729.149.289.399.819.7298.337.817.336.976.727.14
Wind direction (°)N 359°N 0°N 355°NNW 345°NNW 335°NNW 331°NNW 327°NNW 341°NNW 348°N 354°N 354°N 355°N 358°N 0°N 0°N 357°N 357°N 359°N 2°N 1°N 0°N 1°N 1°N 353°

Air humidity

Humidity
Time00:0001:0002:0003:0004:0005:0006:0007:0008:0009:0010:0011:0012:0013:0014:0015:0016:0017:0018:0019:0020:0021:0022:0023:00
Humidity (%)858686868889909186797269656568717274777982858889

Atmospheric pressure

Pressure
Time00:0001:0002:0003:0004:0005:0006:0007:0008:0009:0010:0011:0012:0013:0014:0015:0016:0017:0018:0019:0020:0021:0022:0023:00
Pressure (mm Hg)763763762762762762763763763763762762761761760760759760760761761761761761

Ultraviolet index

UV Index
Time00:0001:0002:0003:0004:0005:0006:0007:0008:0009:0010:0011:0012:0013:0014:0015:0016:0017:0018:0019:0020:0021:0022:0023:00
UV Index0000000.10.71.11.122.34.56.83.44.32.40.70.100000

Air quality & pollen

Air quality
Time00:0001:0002:0003:0004:0005:0006:0007:0008:0009:0010:0011:0012:0013:0014:0015:0016:0017:0018:0019:0020:0021:0022:0023:00
PM2.5 (µg/m³)9.39.49.810.19.99.79.510.811.811.711.711.711.61212.312.512.612.712.912.712.512.512.512.3
PM10 (µg/m³)14.614.815.41615.715.515.317.819.619.619.8202020.721.121.521.621.721.721.120.720.720.620.4
Ozone (O₃) (µg/m³)585755545354555758596060595959585857565554545352
NO₂ (µg/m³)1.21.21.21.21.10.90.70.50.40.30.20.10.10.10.10.10.20.40.60.70.70.70.70.8
SO₂ (µg/m³)0.70.70.70.70.70.70.60.60.60.60.60.60.60.60.60.60.60.60.60.60.60.50.50.5
CO (µg/m³)727170717172747575747474757575757678798182828281

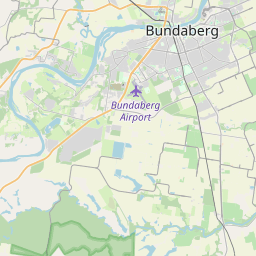
Bundaberg on the map

Data Sources & Methodology

Our weather forecasts are powered by a professional weather data provider that aggregates data from national weather services, satellite observations, radar networks, and over 80,000 weather stations worldwide. Forecast data is updated multiple times daily. We convert raw data into clear summaries — wind speed in m/s, pressure in mmHg — so you can plan your day with confidence.