5-day weather forecast Bundaberg Nov 13, 2026

28°22° · Patchy rain possible

Weather forecast Bundaberg tomorrow Nov 13, 2026: patchy rain possible, temperature from 22 °C to 28 °C.

Precipitation probability 36%. Wind up to 4.81 m/s (gusts 8.36 m/s). Air humidity 63–93%, atmospheric pressure 762–765 mm Hg, UV index up to 11.6.

Sunrise 04:56
Sunset 18:13
Waxing Crescent22% illuminated
Moonrise 07:49 · Moonset 22:06
Chart
Table

Forecast from 22 °C to 28 °C and precipitation

Temperature & Precipitation
Time00:0001:0002:0003:0004:0005:0006:0007:0008:0009:0010:0011:0012:0013:0014:0015:0016:0017:0018:0019:0020:0021:0022:0023:00
Temperature (°C)232222222222232426272827282727272625242323232323
Precipitation (mm/hr)0.0200.030.060.090.080.080.080.070.060.050.150.260.360.270.160.010.0100.0100.010.080.06

Cloud cover and precipitation probability

Cloud cover & Rain chance
Time00:0001:0002:0003:0004:0005:0006:0007:0008:0009:0010:0011:0012:0013:0014:0015:0016:0017:0018:0019:0020:0021:0022:0023:00
Cloud cover (%)756762655074568970885766728884625569909999999890
Rain chance (%)262325282832252919191719263633201013192323243229

Wind speed and direction

Wind & Wind gust
Time00:0001:0002:0003:0004:0005:0006:0007:0008:0009:0010:0011:0012:0013:0014:0015:0016:0017:0018:0019:0020:0021:0022:0023:00
Wind (m/s)2.3122.192.112.312.813.113.393.693.814.114.314.614.814.694.614.694.393.893.53.1932.812.19
Wind gust (m/s)4.814.474.783.944.395.616.586.696.786.927.257.537.928.148.1988.368.117.787.286.836.315.694.22
Wind direction (°)N 353°NNW 348°N 355°N 2°N 1°N 3°N 6°N 4°N 5°N 5°N 6°N 11°NNE 14°NNE 17°NNE 16°NNE 15°NNE 14°NNE 16°NNE 15°NNE 16°NNE 12°N 8°N 9°N 10°

Air humidity

Humidity
Time00:0001:0002:0003:0004:0005:0006:0007:0008:0009:0010:0011:0012:0013:0014:0015:0016:0017:0018:0019:0020:0021:0022:0023:00
Humidity (%)919192929390868174686364646565666771767980808183

Atmospheric pressure

Pressure
Time00:0001:0002:0003:0004:0005:0006:0007:0008:0009:0010:0011:0012:0013:0014:0015:0016:0017:0018:0019:0020:0021:0022:0023:00
Pressure (mm Hg)764764764764764764764765764764764764764763763762762762762763763764764764

Ultraviolet index

UV Index
Time00:0001:0002:0003:0004:0005:0006:0007:0008:0009:0010:0011:0012:0013:0014:0015:0016:0017:0018:0019:0020:0021:0022:0023:00
UV Index0000000.10.92.83.981111.610.67.952.40.70.100000

Air quality & pollen

Air quality
Time00:0001:0002:0003:0004:0005:0006:0007:0008:0009:0010:0011:0012:0013:0014:0015:0016:0017:0018:0019:0020:0021:0022:0023:00
PM2.5 (µg/m³)7.67.67.57.67.67.67.59.69.79.79.79.89.91010.210.511.411.912.712.911.710.79.79.3
PM10 (µg/m³)12.212.3121212.11211.815.415.515.515.515.815.81616.216.617.918.82020.418.516.815.314.6
Ozone (O₃) (µg/m³)605958585859606162636363636364656564636261616059
NO₂ (µg/m³)0.80.80.80.80.80.70.60.50.40.30.20.20.20.20.20.20.30.50.70.911.11.21.2
SO₂ (µg/m³)0.60.60.60.60.60.60.60.60.60.60.60.60.70.70.70.70.70.70.80.80.80.70.70.7
CO (µg/m³)767473737373747576767778797977757373757676767675

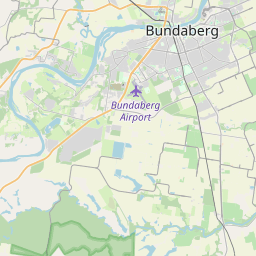
Bundaberg on the map

Data Sources & Methodology

Our weather forecasts are powered by a professional weather data provider that aggregates data from national weather services, satellite observations, radar networks, and over 80,000 weather stations worldwide. Forecast data is updated multiple times daily. We convert raw data into clear summaries — wind speed in m/s, pressure in mmHg — so you can plan your day with confidence.