5-day weather forecast Xepon Nov 16, 2026

32°23° · Patchy rain possible

Weather forecast Xepon Monday Nov 16, 2026: patchy rain possible, temperature from 23 °C to 32 °C.

Precipitation probability 26%. Wind up to 1.89 m/s (gusts 4.33 m/s). Air humidity 57–93%, atmospheric pressure 756–760 mm Hg, UV index up to 8.4.

Sunrise 05:59
Sunset 17:20
First Quarter52% illuminated
Moonrise 11:44 · Moonset 23:23
Chart
Table

Forecast from 23 °C to 32 °C and precipitation

Temperature & Precipitation
Time00:0001:0002:0003:0004:0005:0006:0007:0008:0009:0010:0011:0012:0013:0014:0015:0016:0017:0018:0019:0020:0021:0022:0023:00
Temperature (°C)242323232323232426283031323231313027262525242424
Precipitation (mm/hr)00.010000000.010.030.040.030.050.030.030.040.120.050.060.060.040.0200

Cloud cover and precipitation probability

Cloud cover & Rain chance
Time00:0001:0002:0003:0004:0005:0006:0007:0008:0009:0010:0011:0012:0013:0014:0015:0016:0017:0018:0019:0020:0021:0022:0023:00
Cloud cover (%)706468727772696353818187888671795155606457753029
Rain chance (%)232323242624232217181514171312151717212624261717

Wind speed and direction

Wind & Wind gust
Time00:0001:0002:0003:0004:0005:0006:0007:0008:0009:0010:0011:0012:0013:0014:0015:0016:0017:0018:0019:0020:0021:0022:0023:00
Wind (m/s)0.610.610.50.390.310.390.390.310.310.691.191.611.811.891.51.1910.50.691.3110.810.610.61
Wind gust (m/s)1.281.081.171.221.281.391.471.531.942.673.473.724.064.334.114.173.923.563.192.782.221.6111
Wind direction (°)ENE 57°NE 50°ENE 61°E 79°E 94°E 101°E 99°ESE 105°S 174°SSW 211°SW 224°SW 226°SW 229°SW 236°WSW 248°WSW 256°WSW 252°SSW 194°SE 126°ESE 108°E 101°E 89°ENE 69°ENE 67°

Air humidity

Humidity
Time00:0001:0002:0003:0004:0005:0006:0007:0008:0009:0010:0011:0012:0013:0014:0015:0016:0017:0018:0019:0020:0021:0022:0023:00
Humidity (%)909192929292919083736460575762646876838990919193

Atmospheric pressure

Pressure
Time00:0001:0002:0003:0004:0005:0006:0007:0008:0009:0010:0011:0012:0013:0014:0015:0016:0017:0018:0019:0020:0021:0022:0023:00
Pressure (mm Hg)759759759758758759759760760760760759758757757756756757758758759759759759

Ultraviolet index

UV Index
Time00:0001:0002:0003:0004:0005:0006:0007:0008:0009:0010:0011:0012:0013:0014:0015:0016:0017:0018:0019:0020:0021:0022:0023:00
UV Index00000000.10.41.54.87.78.47.43.61.10.40.1000000

Air quality & pollen

Air quality
Time00:0001:0002:0003:0004:0005:0006:0007:0008:0009:0010:0011:0012:0013:0014:0015:0016:0017:0018:0019:0020:0021:0022:0023:00
PM2.5 (µg/m³)1818.518.818.918.718.718.919.212.18.77.67.16.66.36.36.46.97.78.49.210.110.912.313
PM10 (µg/m³)18.518.919.219.2191919.219.412.48.97.87.26.86.56.56.67.188.59.310.21112.513.1
Ozone (O₃) (µg/m³)38332722191922315279981031009796958973533730262421
NO₂ (µg/m³)10.711.712.613.313.613.613.111.78.33.90.700.10.50.40.41.23.66.89.511.112.112.913.5
SO₂ (µg/m³)4.64.23.83.43.12.92.82.82.93.13.12.92.62.32.22.12.12.22.32.42.42.42.42.3
CO (µg/m³)232221212203198200205205195181170167168170171173175178182187195205213218

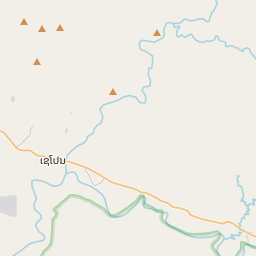
Xepon on the map

Data Sources & Methodology

Our weather forecasts are powered by a professional weather data provider that aggregates data from national weather services, satellite observations, radar networks, and over 80,000 weather stations worldwide. Forecast data is updated multiple times daily. We convert raw data into clear summaries — wind speed in m/s, pressure in mmHg — so you can plan your day with confidence.