5-day weather forecast Xepon Nov 15, 2026

32°21° · Patchy rain possible

Weather forecast Xepon tomorrow Nov 15, 2026: patchy rain possible, temperature from 21 °C to 32 °C.

Precipitation probability 25%. Wind up to 2.11 m/s (gusts 4.67 m/s). Air humidity 52–96%, atmospheric pressure 757–761 mm Hg, UV index up to 8.4.

Sunrise 05:59
Sunset 17:20
First Quarter42% illuminated
Moonrise 11:05 · Moonset 22:33
Chart
Table

Forecast from 21 °C to 32 °C and precipitation

Temperature & Precipitation
Time00:0001:0002:0003:0004:0005:0006:0007:0008:0009:0010:0011:0012:0013:0014:0015:0016:0017:0018:0019:0020:0021:0022:0023:00
Temperature (°C)222121212121212225283031323232313028272625252424
Precipitation (mm/hr)000000000000.020.050.070.060.040.030.020.0100000

Cloud cover and precipitation probability

Cloud cover & Rain chance
Time00:0001:0002:0003:0004:0005:0006:0007:0008:0009:0010:0011:0012:0013:0014:0015:0016:0017:0018:0019:0020:0021:0022:0023:00
Cloud cover (%)2434384036353123116276847555616877849390878277
Rain chance (%)2223242524242316116411131717101114182222232324

Wind speed and direction

Wind & Wind gust
Time00:0001:0002:0003:0004:0005:0006:0007:0008:0009:0010:0011:0012:0013:0014:0015:0016:0017:0018:0019:0020:0021:0022:0023:00
Wind (m/s)1.111110.890.810.810.690.390.310.691.191.692.1121.611.3110.610.110.310.610.810.69
Wind gust (m/s)1.941.691.641.581.421.471.611.8322.172.723.584.144.674.584.253.892.971.810.721.031.391.691.5
Wind direction (°)ENE 63°ENE 59°ENE 58°ENE 57°ENE 57°ENE 57°ENE 60°ENE 68°E 92°SSE 160°SW 219°WSW 244°WSW 251°WSW 253°WSW 250°WSW 246°WSW 241°SW 235°SW 226°S 180°ENE 71°ENE 60°NE 56°ENE 60°

Air humidity

Humidity
Time00:0001:0002:0003:0004:0005:0006:0007:0008:0009:0010:0011:0012:0013:0014:0015:0016:0017:0018:0019:0020:0021:0022:0023:00
Humidity (%)949595969696959282726358555253596269748082848789

Atmospheric pressure

Pressure
Time00:0001:0002:0003:0004:0005:0006:0007:0008:0009:0010:0011:0012:0013:0014:0015:0016:0017:0018:0019:0020:0021:0022:0023:00
Pressure (mm Hg)761761760760759760760761761761761760758758757757757757758758759759760760

Ultraviolet index

UV Index
Time00:0001:0002:0003:0004:0005:0006:0007:0008:0009:0010:0011:0012:0013:0014:0015:0016:0017:0018:0019:0020:0021:0022:0023:00
UV Index00000000.31.33.35.77.78.47.34.71.70.60.1000000

Air quality & pollen

Air quality
Time00:0001:0002:0003:0004:0005:0006:0007:0008:0009:0010:0011:0012:0013:0014:0015:0016:0017:0018:0019:0020:0021:0022:0023:00
PM2.5 (µg/m³)13.41313.112.913.313.513.613.312.28.67.77.47.176.86.77.18.29.911.512.914.315.616.9
PM10 (µg/m³)15.314.814.314.114.114.114.113.812.79.18.17.87.57.37.177.48.610.311.913.314.716.117.4
Ozone (O₃) (µg/m³)514946423934303349739095939087847973676156524742
NO₂ (µg/m³)6.96.76.56.36.16.26.35.84.22.10.500.20.40.50.71.32.43.95.36.47.58.59.6
SO₂ (µg/m³)4.34.13.83.63.33.12.92.833.33.43.232.72.52.42.42.83.43.94.44.854.9
CO (µg/m³)276277278277277279280275256230209199195192189188190195204213226240247243

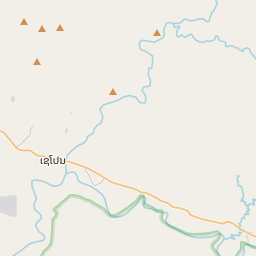
Xepon on the map

Data Sources & Methodology

Our weather forecasts are powered by a professional weather data provider that aggregates data from national weather services, satellite observations, radar networks, and over 80,000 weather stations worldwide. Forecast data is updated multiple times daily. We convert raw data into clear summaries — wind speed in m/s, pressure in mmHg — so you can plan your day with confidence.