5-day weather forecast Wamba Nov 21, 2026

11°9° · Light rain

Weather forecast Wamba Saturday Nov 21, 2026: light rain, temperature from 9 °C to 11 °C.

Precipitation probability 87%. Wind up to 6.31 m/s (gusts 13.64 m/s). Air humidity 87–97%, atmospheric pressure 760–766 mm Hg, UV index up to 0.3.

Sunrise 08:16
Sunset 17:55
Waxing Gibbous95% illuminated
Moonrise 15:43 · Moonset 04:36
Chart
Table

Forecast from 9 °C to 11 °C and precipitation

Temperature & Precipitation
Time00:0001:0002:0003:0004:0005:0006:0007:0008:0009:0010:0011:0012:0013:0014:0015:0016:0017:0018:0019:0020:0021:0022:0023:00
Temperature (°C)9999999999910101010101010101110111111
Precipitation (mm/hr)0.270.340.40.440.430.530.461.010.580.760.461.212.432.882.983.12.682.692.11.581.221.461.381

Cloud cover and precipitation probability

Cloud cover & Rain chance
Time00:0001:0002:0003:0004:0005:0006:0007:0008:0009:0010:0011:0012:0013:0014:0015:0016:0017:0018:0019:0020:0021:0022:0023:00
Cloud cover (%)1001001001001001001001001001001001001001001001001001001001001001009693
Rain chance (%)576164656467637371706777858787878686838077797774

Wind speed and direction

Wind & Wind gust
Time00:0001:0002:0003:0004:0005:0006:0007:0008:0009:0010:0011:0012:0013:0014:0015:0016:0017:0018:0019:0020:0021:0022:0023:00
Wind (m/s)2.521.691.892.312.312.6933.113.694.194.114.113.89444.394.314.394.895.315.315.616.31
Wind gust (m/s)5.034.754.284.675.116.257.068.448.759.039.229.199.59.5310.2210.2211.6710.9210.510.6710.5811.0812.4413.64
Wind direction (°)SSE 155°SSE 155°SSE 149°SSE 150°SSE 156°S 178°S 175°S 189°S 187°S 187°S 187°S 189°SSW 197°SSW 201°SSW 198°S 191°SSW 198°SSW 201°SSW 210°SW 225°SW 215°SSW 210°SSW 202°SW 227°

Air humidity

Humidity
Time00:0001:0002:0003:0004:0005:0006:0007:0008:0009:0010:0011:0012:0013:0014:0015:0016:0017:0018:0019:0020:0021:0022:0023:00
Humidity (%)949393929089878992939494959696979696969594949393

Atmospheric pressure

Pressure
Time00:0001:0002:0003:0004:0005:0006:0007:0008:0009:0010:0011:0012:0013:0014:0015:0016:0017:0018:0019:0020:0021:0022:0023:00
Pressure (mm Hg)766765765764764764764764764764764764763763762761761760760760760760760761

Ultraviolet index

UV Index
Time00:0001:0002:0003:0004:0005:0006:0007:0008:0009:0010:0011:0012:0013:0014:0015:0016:0017:0018:0019:0020:0021:0022:0023:00
UV Index00000000000.10.30.20.10.20.100000000

Air quality & pollen

Air quality
Time00:0001:0002:0003:0004:0005:0006:0007:0008:0009:0010:0011:0012:0013:0014:0015:0016:0017:0018:0019:0020:0021:0022:0023:00
PM2.5 (µg/m³)5.66.777.86.54.84.44.3455.24.64.23.12.82.42.221.821.91.91.81.6
PM10 (µg/m³)7.88.68.99.49.17.66.65.75.266.45.65.243.43.132.62.62.72.82.92.82.3
Ozone (O₃) (µg/m³)343334303439423739404249535858585758565655535456.3
NO₂ (µg/m³)6.27.49.410.67.15.64.9556.35.654.8432.41.91.92.12.32.52.62.62.1
SO₂ (µg/m³)0.40.50.60.70.50.40.30.40.60.70.60.50.40.30.20.10.10.10.10.10.10.10.10.2
CO (µg/m³)134137142139135132131132132133131129127125124122122124124122119118116116.5

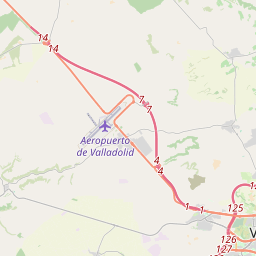
Wamba on the map

Data Sources & Methodology

Our weather forecasts are powered by a professional weather data provider that aggregates data from national weather services, satellite observations, radar networks, and over 80,000 weather stations worldwide. Forecast data is updated multiple times daily. We convert raw data into clear summaries — wind speed in m/s, pressure in mmHg — so you can plan your day with confidence.