5-day weather forecast Wamba Nov 20, 2026

12°8° · Patchy rain possible

Weather forecast Wamba tomorrow Nov 20, 2026: patchy rain possible, temperature from 8 °C to 12 °C.

Precipitation probability 60%. Wind up to 6.61 m/s (gusts 12.22 m/s). Air humidity 67–93%, atmospheric pressure 765–767 mm Hg, UV index up to 1.6.

Sunrise 08:14
Sunset 17:55
Waxing Gibbous89% illuminated
Moonrise 15:21 · Moonset 03:32
Chart
Table

Forecast from 8 °C to 12 °C and precipitation

Temperature & Precipitation
Time00:0001:0002:0003:0004:0005:0006:0007:0008:0009:0010:0011:0012:0013:0014:0015:0016:0017:0018:0019:0020:0021:0022:0023:00
Temperature (°C)8888888889910111212121211101010999
Precipitation (mm/hr)0.020.020.020.020.010.010.0100.010.030.040.050.070.090.070.050.030.060.120.160.180.160.230.32

Cloud cover and precipitation probability

Cloud cover & Rain chance
Time00:0001:0002:0003:0004:0005:0006:0007:0008:0009:0010:0011:0012:0013:0014:0015:0016:0017:0018:0019:0020:0021:0022:0023:00
Cloud cover (%)1001001009999991001001001001001009995100898797100100100100100100
Rain chance (%)292930303130313132333230272624201725344649495360

Wind speed and direction

Wind & Wind gust
Time00:0001:0002:0003:0004:0005:0006:0007:0008:0009:0010:0011:0012:0013:0014:0015:0016:0017:0018:0019:0020:0021:0022:0023:00
Wind (m/s)6.56.616.396.115.695.54.894.694.694.614.895.115.114.894.814.3943.112.612.111.811.51.392.31
Wind gust (m/s)12.2212.1411.6711.0310.8910.229.288.7598.928.948.728.618.588.287.787.146.144.674.334.143.643.084.67
Wind direction (°)SW 233°SW 233°SW 236°WSW 238°WSW 240°WSW 240°SW 236°SW 231°SW 230°SW 234°WSW 237°WSW 238°WSW 241°WSW 243°WSW 244°WSW 244°WSW 242°SW 232°SW 225°SW 222°SSW 210°SSW 194°S 176°SSE 160°

Air humidity

Humidity
Time00:0001:0002:0003:0004:0005:0006:0007:0008:0009:0010:0011:0012:0013:0014:0015:0016:0017:0018:0019:0020:0021:0022:0023:00
Humidity (%)868787889090909291908881757170696773808688909193

Atmospheric pressure

Pressure
Time00:0001:0002:0003:0004:0005:0006:0007:0008:0009:0010:0011:0012:0013:0014:0015:0016:0017:0018:0019:0020:0021:0022:0023:00
Pressure (mm Hg)765765766766766766766766767767767767767767767766766766766767767767767766

Ultraviolet index

UV Index
Time00:0001:0002:0003:0004:0005:0006:0007:0008:0009:0010:0011:0012:0013:0014:0015:0016:0017:0018:0019:0020:0021:0022:0023:00
UV Index00000000000.30.71.31.51.61.20.60.2000000

Air quality & pollen

Air quality
Time00:0001:0002:0003:0004:0005:0006:0007:0008:0009:0010:0011:0012:0013:0014:0015:0016:0017:0018:0019:0020:0021:0022:0023:00
PM2.5 (µg/m³)2.732.72.32.52.73.13.73.83.63.32.92.62.52.42.32.22.32.63.13.844.95.2
PM10 (µg/m³)6.46.15.85.75.25.56.877.576.55.95.44.84.54.13.73.94.55.25.86.577.9
Ozone (O₃) (µg/m³)656464646464626160606063666868686866615648444238
NO₂ (µg/m³)1.21.21.11.11111.21.82.12.11.71.31.21.11.21.11.62.83.44.85.35.75.9
SO₂ (µg/m³)0.10.10.10.10.10.10.10.10.20.20.20.10.10.10.10.10.10.10.20.30.30.30.30.3
CO (µg/m³)129127127127127127126127127128127126126125125125125127129131132133133135

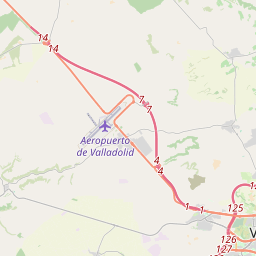
Wamba on the map

Data Sources & Methodology

Our weather forecasts are powered by a professional weather data provider that aggregates data from national weather services, satellite observations, radar networks, and over 80,000 weather stations worldwide. Forecast data is updated multiple times daily. We convert raw data into clear summaries — wind speed in m/s, pressure in mmHg — so you can plan your day with confidence.