5-day weather forecast Thompson Nov 19, 2026

-1°-4° · Overcast

Weather forecast Thompson Thursday Nov 19, 2026: overcast, temperature from -4 °C to -1 °C.

Precipitation probability 43%. Wind up to 2.5 m/s (gusts 5.44 m/s). Air humidity 75–98%, atmospheric pressure 762–767 mm Hg, UV index up to 0.4.

Sunrise 09:15
Sunset 17:18
Waxing Gibbous81% illuminated
Moonrise 15:14 · Moonset 02:54
Chart
Table

Forecast from -4 °C to -1 °C and precipitation

Temperature & Precipitation
Time00:0001:0002:0003:0004:0005:0006:0007:0008:0009:0010:0011:0012:0013:0014:0015:0016:0017:0018:0019:0020:0021:0022:0023:00
Temperature (°C)-2-2-3-3-3-3-3-2-3-3-2-2-10000-1-2-2-3-3-3-4
Precipitation (mm/hr)000000000000000000000.010.010.010.01

Cloud cover and precipitation probability

Cloud cover & Rain chance
Time00:0001:0002:0003:0004:0005:0006:0007:0008:0009:0010:0011:0012:0013:0014:0015:0016:0017:0018:0019:0020:0021:0022:0023:00
Cloud cover (%)1009999100991001009910010010010098821001001001001009999937699
Rain chance (%)424242434339383232313128251922222226283030292632

Wind speed and direction

Wind & Wind gust
Time00:0001:0002:0003:0004:0005:0006:0007:0008:0009:0010:0011:0012:0013:0014:0015:0016:0017:0018:0019:0020:0021:0022:0023:00
Wind (m/s)0.690.810.50.891.111.311.391.611.691.892.192.312.392.52.312.111.891.311.110.891.111.311.692
Wind gust (m/s)1.311.471.361.831.672.673.333.754.534.895.445.445.255.3654.864.6433.112.973.6944.254.83
Wind direction (°)ENE 70°NE 37°N 7°NNW 335°NW 318°NW 310°WNW 302°WNW 293°NW 310°NW 324°NNW 334°NNW 344°N 351°N 355°NNW 348°NNW 342°NNW 337°NNW 333°NNW 334°NNW 346°NE 35°NE 53°NE 54°ENE 61°

Air humidity

Humidity
Time00:0001:0002:0003:0004:0005:0006:0007:0008:0009:0010:0011:0012:0013:0014:0015:0016:0017:0018:0019:0020:0021:0022:0023:00
Humidity (%)979898989896949392929287827775757783868989909191

Atmospheric pressure

Pressure
Time00:0001:0002:0003:0004:0005:0006:0007:0008:0009:0010:0011:0012:0013:0014:0015:0016:0017:0018:0019:0020:0021:0022:0023:00
Pressure (mm Hg)763762762762762762762762762763763764764764764764764765766766766767767767

Ultraviolet index

UV Index
Time00:0001:0002:0003:0004:0005:0006:0007:0008:0009:0010:0011:0012:0013:0014:0015:0016:0017:0018:0019:0020:0021:0022:0023:00
UV Index00000000000.20.30.40.40.30.200000000

Air quality & pollen

Air quality
Time00:0001:0002:0003:0004:0005:0006:0007:0008:0009:0010:0011:0012:0013:0014:0015:0016:0017:0018:0019:0020:0021:0022:0023:00
PM2.5 (µg/m³)0.30.20.20.20.20.20.30.30.30.30.20.10.100000000.10.10.10.2
PM10 (µg/m³)0.40.30.20.20.20.30.30.40.40.30.20.20.100000000.10.10.20.2
Ozone (O₃) (µg/m³)697071727271706865636160606162636362626363646464
NO₂ (µg/m³)0.20.20.10.10.10.10.10.20.30.30.30.20.10.10.10.10.10.10.10.10.10.10.10.1
SO₂ (µg/m³)0.20.20.10.10.10.10.10.10.20.20.20.20.20.20.10.10.10.10.10.10.10.10.10.2
CO (µg/m³)115113113113113113113115117118117115113112113114118124127125120116113110

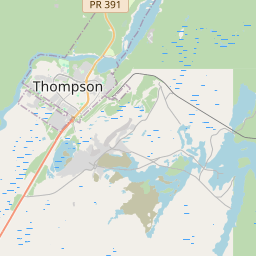
Thompson on the map

Data Sources & Methodology

Our weather forecasts are powered by a professional weather data provider that aggregates data from national weather services, satellite observations, radar networks, and over 80,000 weather stations worldwide. Forecast data is updated multiple times daily. We convert raw data into clear summaries — wind speed in m/s, pressure in mmHg — so you can plan your day with confidence.