5-day weather forecast Thompson Nov 18, 2026

1°-3° · Mist

Weather forecast Thompson tomorrow Nov 18, 2026: mist, temperature from -3 °C to 1 °C.

Precipitation probability 39%. Wind up to 1.89 m/s (gusts 3.72 m/s). Air humidity 80–96%, atmospheric pressure 762–764 mm Hg, UV index up to 0.4.

Sunrise 09:13
Sunset 17:20
Waxing Gibbous73% illuminated
Moonrise 15:09 · Moonset 01:38
Chart
Table

Forecast from -3 °C to 1 °C and precipitation

Temperature & Precipitation
Time00:0001:0002:0003:0004:0005:0006:0007:0008:0009:0010:0011:0012:0013:0014:0015:0016:0017:0018:0019:0020:0021:0022:0023:00
Temperature (°C)-3-3-3-3-3-3-3-2-2-2-2-1011110-1-2-2-2-2-2
Precipitation (mm/hr)000000000000000000000000

Cloud cover and precipitation probability

Cloud cover & Rain chance
Time00:0001:0002:0003:0004:0005:0006:0007:0008:0009:0010:0011:0012:0013:0014:0015:0016:0017:0018:0019:0020:0021:0022:0023:00
Cloud cover (%)20185565708088707677701001001001009710010094971009697100
Rain chance (%)222127303133353133333130272524242528293132373839

Wind speed and direction

Wind & Wind gust
Time00:0001:0002:0003:0004:0005:0006:0007:0008:0009:0010:0011:0012:0013:0014:0015:0016:0017:0018:0019:0020:0021:0022:0023:00
Wind (m/s)1.891.611.391.191.111.311.311.311.311.191.311.391.391.51.391.311.191.191.111.111.11110.89
Wind gust (m/s)3.722.752.532.141.922.362.282.722.222.112.922.973.113.283.173.113.312.972.3122.031.831.861.44
Wind direction (°)WNW 295°NW 306°NW 306°NW 308°NW 315°NNW 331°NNW 336°NNW 344°N 351°N 358°NNE 15°NNE 29°NE 37°NE 50°NE 52°NE 52°NE 50°NE 47°NE 48°NE 49°NE 54°ENE 60°ENE 63°ENE 68°

Air humidity

Humidity
Time00:0001:0002:0003:0004:0005:0006:0007:0008:0009:0010:0011:0012:0013:0014:0015:0016:0017:0018:0019:0020:0021:0022:0023:00
Humidity (%)959595959595969696969690858080808287909394949596

Atmospheric pressure

Pressure
Time00:0001:0002:0003:0004:0005:0006:0007:0008:0009:0010:0011:0012:0013:0014:0015:0016:0017:0018:0019:0020:0021:0022:0023:00
Pressure (mm Hg)762763763763764764764764764764764764764764764764763763763763763763763763

Ultraviolet index

UV Index
Time00:0001:0002:0003:0004:0005:0006:0007:0008:0009:0010:0011:0012:0013:0014:0015:0016:0017:0018:0019:0020:0021:0022:0023:00
UV Index00000000000.20.30.40.40.30.200000000

Air quality & pollen

Air quality
Time00:0001:0002:0003:0004:0005:0006:0007:0008:0009:0010:0011:0012:0013:0014:0015:0016:0017:0018:0019:0020:0021:0022:0023:00
PM2.5 (µg/m³)1.11.11.11.11.111.11.11.11.11.11.20.80.70.70.70.70.70.70.70.60.50.40.3
PM10 (µg/m³)1.41.41.41.31.31.31.31.31.31.41.31.51.10.90.90.80.9110.90.80.60.50.4
Ozone (O₃) (µg/m³)555453525149484643445059666970706865636364656668
NO₂ (µg/m³)0.60.60.50.50.50.50.60.81.11.210.60.30.20.20.20.30.50.60.60.50.40.30.3
SO₂ (µg/m³)0.20.20.20.20.20.20.20.20.20.20.20.30.30.30.30.30.30.30.30.30.20.20.20.2
CO (µg/m³)120118115112110109111120132138133123116114114117125135141139134128123119

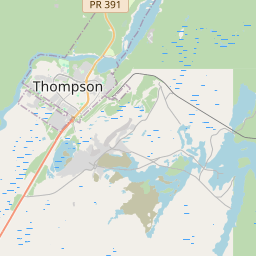
Thompson on the map

Data Sources & Methodology

Our weather forecasts are powered by a professional weather data provider that aggregates data from national weather services, satellite observations, radar networks, and over 80,000 weather stations worldwide. Forecast data is updated multiple times daily. We convert raw data into clear summaries — wind speed in m/s, pressure in mmHg — so you can plan your day with confidence.