5-day weather forecast Tarariras Nov 24, 2026

27°18° · Partly cloudy

Weather forecast Tarariras Tuesday Nov 24, 2026: partly cloudy, temperature from 18 °C to 27 °C.

Precipitation probability 16%. Wind up to 8.11 m/s (gusts 13.39 m/s). Air humidity 41–79%, atmospheric pressure 756–761 mm Hg, UV index up to 9.8.

Sunrise 05:33
Sunset 19:41
Full Moon99% illuminated
Moonrise 20:00 · Moonset 04:55
Chart
Table

Forecast from 18 °C to 27 °C and precipitation

Temperature & Precipitation
Time00:0001:0002:0003:0004:0005:0006:0007:0008:0009:0010:0011:0012:0013:0014:0015:0016:0017:0018:0019:0020:0021:0022:0023:00
Temperature (°C)202019191818182022242425262627272727262523212019
Precipitation (mm/hr)00000000000.010.020.030.020.01000000000

Cloud cover and precipitation probability

Cloud cover & Rain chance
Time00:0001:0002:0003:0004:0005:0006:0007:0008:0009:0010:0011:0012:0013:0014:0015:0016:0017:0018:0019:0020:0021:0022:0023:00
Cloud cover (%)80685643505764585245895053517757555151489443
Rain chance (%)11101091113161396116658544442322

Wind speed and direction

Wind & Wind gust
Time00:0001:0002:0003:0004:0005:0006:0007:0008:0009:0010:0011:0012:0013:0014:0015:0016:0017:0018:0019:0020:0021:0022:0023:00
Wind (m/s)3.312.391.8922.391.812.52.312.312.693.194.114.614.614.815.394.195.54.694.898.117.816.55.39
Wind gust (m/s)5.975.113.533.895.032.863.54.284.1455.56.477.397.948.839.148.338.758.59.7211.8613.3911.8110.42
Wind direction (°)NW 314°NW 314°NW 310°WNW 301°WNW 296°W 269°W 264°WSW 256°WSW 250°WSW 237°WSW 237°WSW 239°WSW 241°WSW 254°W 260°W 264°WSW 254°WSW 244°WSW 237°SW 217°S 178°SSE 158°SSE 147°SE 139°

Air humidity

Humidity
Time00:0001:0002:0003:0004:0005:0006:0007:0008:0009:0010:0011:0012:0013:0014:0015:0016:0017:0018:0019:0020:0021:0022:0023:00
Humidity (%)616467707376797567595450454543424241424246545352

Atmospheric pressure

Pressure
Time00:0001:0002:0003:0004:0005:0006:0007:0008:0009:0010:0011:0012:0013:0014:0015:0016:0017:0018:0019:0020:0021:0022:0023:00
Pressure (mm Hg)757757756756756756757757758758758758758758757757756756756757758759760761

Ultraviolet index

UV Index
Time00:0001:0002:0003:0004:0005:0006:0007:0008:0009:0010:0011:0012:0013:0014:0015:0016:0017:0018:0019:0020:0021:0022:0023:00
UV Index00000000.312.14.25.57.69.79.885.32.80.30.20000

Air quality & pollen

Air quality
Time00:0001:0002:0003:0004:0005:0006:0007:0008:0009:0010:0011:0012:0013:0014:0015:0016:0017:0018:0019:0020:0021:0022:0023:00
PM2.5 (µg/m³)6.56.87.388.69.19.59.69.38.97.97.87.76.45.44.13.53.332.521.81.81.9
PM10 (µg/m³)7.67.88.28.89.39.71010.2109.68.78.68.46.85.74.74.44.54.13.42.82.52.52.8
Ozone (O₃) (µg/m³)363228262525283340506788102104100938473635650454342
NO₂ (µg/m³)15.918.520.922.422.922.521.218.514.811.38.35.43.32.21.81.71.71.92.12.22.22.11.81.4
SO₂ (µg/m³)4.24.75.15.55.65.65.86.57.37.56.75.243.22.62.21.91.81.61.310.80.60.5
CO (µg/m³)142138134140168207235244241227196154123114115117112106114151200189.8157116.5

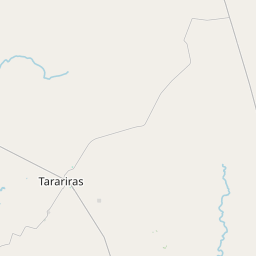
Tarariras on the map

Data Sources & Methodology

Our weather forecasts are powered by a professional weather data provider that aggregates data from national weather services, satellite observations, radar networks, and over 80,000 weather stations worldwide. Forecast data is updated multiple times daily. We convert raw data into clear summaries — wind speed in m/s, pressure in mmHg — so you can plan your day with confidence.