5-day weather forecast Saint Paul Nov 20, 2026

17°5° · Overcast

Weather forecast Saint Paul Friday Nov 20, 2026: overcast, temperature from 5 °C to 17 °C.

Precipitation probability 27%. Wind up to 7.61 m/s (gusts 15.64 m/s). Air humidity 63–89%, atmospheric pressure 755–767 mm Hg, UV index up to 1.5.

5 days at a glance — tap a day to open it
Sunrise 07:16
Sunset 16:39
Waxing Gibbous89% illuminated
Moonrise 14:16 · Moonset 02:42
Chart
Table

Forecast from 5 °C to 17 °C and precipitation

Temperature & Precipitation
Time00:0001:0002:0003:0004:0005:0006:0007:0008:0009:0010:0011:0012:0013:0014:0015:0016:0017:0018:0019:0020:0021:0022:0023:00
Temperature (°C)55555557891114151616171615151515151515
Precipitation (mm/hr)000000000000000000000.010.010.010

Cloud cover and precipitation probability

Cloud cover & Rain chance
Time00:0001:0002:0003:0004:0005:0006:0007:0008:0009:0010:0011:0012:0013:0014:0015:0016:0017:0018:0019:0020:0021:0022:0023:00
Cloud cover (%)778083869193969489837254547384969696969198100100100
Rain chance (%)18181818202326272724181291113151617181820212020

Wind speed and direction

Wind & Wind gust
Time00:0001:0002:0003:0004:0005:0006:0007:0008:0009:0010:0011:0012:0013:0014:0015:0016:0017:0018:0019:0020:0021:0022:0023:00
Wind (m/s)1.612.112.392.893.113.393.694.194.615.115.395.696.116.6177.397.397.397.57.617.617.617.397.31
Wind gust (m/s)2.443.835.116.196.837.819.1110.1411.1411.7212.1412.4213.1113.8914.6715.2515.2815.3315.4215.6415.5615.4714.8914.44
Wind direction (°)SE 127°SE 124°ESE 122°ESE 122°SE 126°SE 131°SE 136°SE 140°SE 144°SSE 147°SSE 152°SSE 158°SSE 163°SSE 165°SSE 167°S 169°S 172°S 176°S 179°S 183°S 186°S 189°S 189°S 189°

Air humidity

Humidity
Time00:0001:0002:0003:0004:0005:0006:0007:0008:0009:0010:0011:0012:0013:0014:0015:0016:0017:0018:0019:0020:0021:0022:0023:00
Humidity (%)777675757681858889877972666463636569717273737373

Atmospheric pressure

Pressure
Time00:0001:0002:0003:0004:0005:0006:0007:0008:0009:0010:0011:0012:0013:0014:0015:0016:0017:0018:0019:0020:0021:0022:0023:00
Pressure (mm Hg)767767767767766765764764764763762761760758758757756756756756756756756755

Ultraviolet index

UV Index
Time00:0001:0002:0003:0004:0005:0006:0007:0008:0009:0010:0011:0012:0013:0014:0015:0016:0017:0018:0019:0020:0021:0022:0023:00
UV Index0000000000.30.81.21.51.40.90.40.10000000

Air quality & pollen

Air quality
Time00:0001:0002:0003:0004:0005:0006:0007:0008:0009:0010:0011:0012:0013:0014:0015:0016:0017:0018:0019:0020:0021:0022:0023:00
PM2.5 (µg/m³)22.815.710.887.68.710.211.511.59.28.66.86.56.36.15.95.45.155.15.25.45.65.7
PM10 (µg/m³)23.11611.28.58910.311.811.89.78.87.57.27.176.96.36.166.16.36.46.76.8
Ozone (O₃) (µg/m³)026101623293235384452586367707273737372717272
NO₂ (µg/m³)39.536.833.429.624.719.415.815.717.417.714.810.57.26.16.16.26.36.56.87.27.67.66.75.4
SO₂ (µg/m³)2.41.91.410.911.11.21.41.51.51.41.31.21.21.11.11111111
CO (µg/m³)658547364224180180190208237250232200174164161160161164165161155150147145

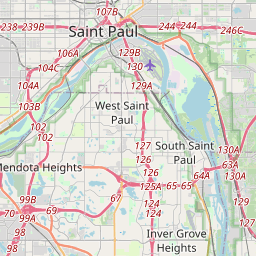
Saint Paul on the map

Data Sources & Methodology

Our weather forecasts are powered by a professional weather data provider that aggregates data from national weather services, satellite observations, radar networks, and over 80,000 weather stations worldwide. Forecast data is updated multiple times daily. We convert raw data into clear summaries — wind speed in m/s, pressure in mmHg — so you can plan your day with confidence.