5-day weather forecast Nijmegen Nov 7, 2026

10°2° · Overcast

Weather forecast Nijmegen Saturday Nov 7, 2026: overcast, temperature from 2 °C to 10 °C.

Precipitation probability 30%. Wind up to 2.39 m/s (gusts 5.11 m/s). Air humidity 75–92%, atmospheric pressure 767–768 mm Hg, UV index up to 0.8.

5 days at a glance — tap a day to open it
Sunrise 07:41
Sunset 16:58
New Moon2% illuminated
Moonrise 05:33 · Moonset 15:42
Chart
Table

Forecast from 2 °C to 10 °C and precipitation

Temperature & Precipitation
Time00:0001:0002:0003:0004:0005:0006:0007:0008:0009:0010:0011:0012:0013:0014:0015:0016:0017:0018:0019:0020:0021:0022:0023:00
Temperature (°C)54653552455898101089979877
Precipitation (mm/hr)0000000000000000000.0100000

Cloud cover and precipitation probability

Cloud cover & Rain chance
Time00:0001:0002:0003:0004:0005:0006:0007:0008:0009:0010:0011:0012:0013:0014:0015:0016:0017:0018:0019:0020:0021:0022:0023:00
Cloud cover (%)100541001004010089401001004010010043100100641001009810010081100
Rain chance (%)241923241825241927241621211322231927283028282629

Wind speed and direction

Wind & Wind gust
Time00:0001:0002:0003:0004:0005:0006:0007:0008:0009:0010:0011:0012:0013:0014:0015:0016:0017:0018:0019:0020:0021:0022:0023:00
Wind (m/s)1.111.111.191.1111.391.50.811.391.610.892.112.1912.312.391.392.112.311.812.312.191.692
Wind gust (m/s)1.112.781.225.112.751.421.52.641.422.313.533.113.223.863.113.563.143.2243.673.693.52.862.39
Wind direction (°)SSW 201°ESE 103°SW 232°SW 230°ESE 115°SW 230°SW 227°SE 138°SW 225°SW 220°SSE 155°SW 227°SW 235°SSW 196°SW 232°SW 225°SSW 199°SSW 210°SW 217°SW 222°SW 235°SW 235°SSW 211°WSW 239°

Air humidity

Humidity
Time00:0001:0002:0003:0004:0005:0006:0007:0008:0009:0010:0011:0012:0013:0014:0015:0016:0017:0018:0019:0020:0021:0022:0023:00
Humidity (%)808878819082839285808575757877788485869186869089

Atmospheric pressure

Pressure
Time00:0001:0002:0003:0004:0005:0006:0007:0008:0009:0010:0011:0012:0013:0014:0015:0016:0017:0018:0019:0020:0021:0022:0023:00
Pressure (mm Hg)768768768768768767767768767768768768768767767767767767767767767767767767

Ultraviolet index

UV Index
Time00:0001:0002:0003:0004:0005:0006:0007:0008:0009:0010:0011:0012:0013:0014:0015:0016:0017:0018:0019:0020:0021:0022:0023:00
UV Index0000000000.10.40.60.80.80.60.40.10000000

Air quality & pollen

Air quality
Time00:0001:0002:0003:0004:0005:0006:0007:0008:0009:0010:0011:0012:0013:0014:0015:0016:0017:0018:0019:0020:0021:0022:0023:00
PM2.5 (µg/m³)16.617.416.817.41616.216.416.817.217.918.521.221.722.523.424.325.827.529.631.332.833.533.537.2
PM10 (µg/m³)18.919.71919.719.619.21919.220.321.823.424.825.426.227.128.130.132.535.137.138.338.638.140.7
Ozone (O₃) (µg/m³)23222018161514118132024283130272213852131.5
NO₂ (µg/m³)24.124.824.924.32424.224.625.52725.521.420.119.61821.125.228.630.836.937.935.534.133.531
SO₂ (µg/m³)1.91.81.51.51.51.61.82.12.43.15.47.26.86.15.84.82.61.41.21.11.110.91.5
CO (µg/m³)255250239238241242247257271293335365380381375361342339356372362356355344.8

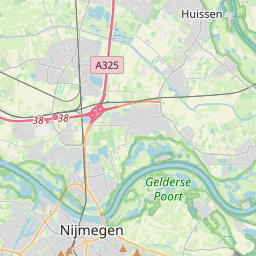
Nijmegen on the map

Data Sources & Methodology

Our weather forecasts are powered by a professional weather data provider that aggregates data from national weather services, satellite observations, radar networks, and over 80,000 weather stations worldwide. Forecast data is updated multiple times daily. We convert raw data into clear summaries — wind speed in m/s, pressure in mmHg — so you can plan your day with confidence.