5-day weather forecast Niagara Oct 27, 2026

12°3° · Patchy rain possible

Weather forecast Niagara tomorrow Oct 27, 2026: patchy rain possible, temperature from 3 °C to 12 °C.

Precipitation probability 52%. Wind up to 4.31 m/s (gusts 9.53 m/s). Air humidity 68–97%, atmospheric pressure 767–773 mm Hg, UV index up to 0.4.

Sunrise 07:25
Sunset 17:46
Waning Gibbous94% illuminated
Moonrise 18:07 · Moonset 09:18
Chart
Table

Forecast from 3 °C to 12 °C and precipitation

Temperature & Precipitation
Time00:0001:0002:0003:0004:0005:0006:0007:0008:0009:0010:0011:0012:0013:0014:0015:0016:0017:0018:0019:0020:0021:0022:0023:00
Temperature (°C)5444444344567108111210997799
Precipitation (mm/hr)0.060.090.120.110.250.30.10.030.010.0300000000000000

Cloud cover and precipitation probability

Cloud cover & Rain chance
Time00:0001:0002:0003:0004:0005:0006:0007:0008:0009:0010:0011:0012:0013:0014:0015:0016:0017:0018:0019:0020:0021:0022:0023:00
Cloud cover (%)1001001001001001001001001001009598100967698809810083338885100
Rain chance (%)232932324552363428312728281920181421242418363542

Wind speed and direction

Wind & Wind gust
Time00:0001:0002:0003:0004:0005:0006:0007:0008:0009:0010:0011:0012:0013:0014:0015:0016:0017:0018:0019:0020:0021:0022:0023:00
Wind (m/s)2.52.112.312.112.112.392.192.311.812.112.193.313.3943.113.614.313.53.193.612.1123.391.89
Wind gust (m/s)4.54.724.534.224.674.814.924.754.726.315.898.117.59.037.427.319.538.429.038.618.228.818.679.5
Wind direction (°)ENE 66°ENE 69°ENE 72°E 95°E 87°E 81°E 94°E 82°E 83°E 92°E 91°ESE 107°ESE 118°SE 138°SE 125°SE 129°SSE 148°SE 142°SE 132°SE 142°SE 131°SE 142°SSE 165°S 172°

Air humidity

Humidity
Time00:0001:0002:0003:0004:0005:0006:0007:0008:0009:0010:0011:0012:0013:0014:0015:0016:0017:0018:0019:0020:0021:0022:0023:00
Humidity (%)687376777782839185888788877281706976808793979597

Atmospheric pressure

Pressure
Time00:0001:0002:0003:0004:0005:0006:0007:0008:0009:0010:0011:0012:0013:0014:0015:0016:0017:0018:0019:0020:0021:0022:0023:00
Pressure (mm Hg)773773773773773773773772773772772771771770769768767768767767767767767767

Ultraviolet index

UV Index
Time00:0001:0002:0003:0004:0005:0006:0007:0008:0009:0010:0011:0012:0013:0014:0015:0016:0017:0018:0019:0020:0021:0022:0023:00
UV Index0000000000.10.10.20.30.40.40.20.30.2000000

Air quality & pollen

Air quality
Time00:0001:0002:0003:0004:0005:0006:0007:0008:0009:0010:0011:0012:0013:0014:0015:0016:0017:0018:0019:0020:0021:0022:0023:00
PM2.5 (µg/m³)0.40.40.40.40.40.50.50.80.80.80.60.60.81.21.41.51.722.12.43.14.66.27.8
PM10 (µg/m³)0.40.40.40.50.50.50.60.90.90.80.60.711.31.51.71.92.22.22.53.24.76.37.8
Ozone (O₃) (µg/m³)656666656565656565666667676869696968666463636260
NO₂ (µg/m³)0.90.90.911.11.21.31.31.31.31.21.110.90.911.11.31.61.92.42.93.54.1
SO₂ (µg/m³)0.20.20.20.20.20.20.20.20.20.20.20.20.30.30.40.40.50.50.50.60.81.11.41.7
CO (µg/m³)111108107107108110113116120124125120112108111117122125128130131131133138

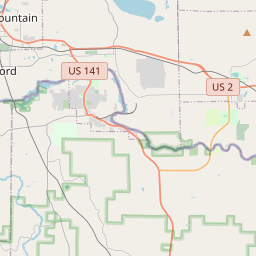
Niagara on the map

Data Sources & Methodology

Our weather forecasts are powered by a professional weather data provider that aggregates data from national weather services, satellite observations, radar networks, and over 80,000 weather stations worldwide. Forecast data is updated multiple times daily. We convert raw data into clear summaries — wind speed in m/s, pressure in mmHg — so you can plan your day with confidence.