5-day weather forecast Niagara Falls 09-07-2026

Weather forecast Niagara Falls tomorrow 09.07.2026: sunny, temperature from 20 °C to 28 °C.

Precipitation probability 13%. Wind up to 5.5 m/s (gusts 6.83 m/s). Air humidity 53–94%, atmospheric pressure 758–760 mm Hg, UV index up to 8.4.

Sunrise 05:45
Sunset 20:57
Waning Crescent19% illuminated
Moonrise 01:00 · Moonset 15:54
Chart
Table

Forecast from 20 °C to 28 °C and precipitation

Temperature & Precipitation
Time00:0001:0002:0003:0004:0005:0006:0007:0008:0009:0010:0011:0012:0013:0014:0015:0016:0017:0018:0019:0020:0021:0022:0023:00
Temperature (°C)212121212020202122242526272828282525222322212121
Precipitation (mm/hr)00000000000000.060.040.840.550.420.110.370.01000

Cloud cover and precipitation probability

Cloud cover & Rain chance
Time00:0001:0002:0003:0004:0005:0006:0007:0008:0009:0010:0011:0012:0013:0014:0015:0016:0017:0018:0019:0020:0021:0022:0023:00
Cloud cover (%)1151219181076881526288081867070748265685940
Rain chance (%)13131415151515131065541712464638344923242219

Wind speed and direction

Wind & Wind gust
Time00:0001:0002:0003:0004:0005:0006:0007:0008:0009:0010:0011:0012:0013:0014:0015:0016:0017:0018:0019:0020:0021:0022:0023:00
Wind (m/s)3.393.393.1932.692.52.612.693.193.393.693.814.395.115.55.393.692.691.521.811.391.191.5
Wind gust (m/s)6.726.566.065.695.314.925.084.644.584.424.614.565.175.866.446.836.173.782.582.972.942.582.222.78
Wind direction (°)SSW 201°SSW 204°SW 215°SW 232°SW 236°SW 221°SSW 212°SSW 212°SW 222°SW 223°SW 223°SW 223°SW 223°SW 226°SW 229°WSW 240°WSW 248°WNW 288°N 359°NE 38°ENE 57°ENE 66°ENE 76°ESE 102°

Air humidity

Humidity
Time00:0001:0002:0003:0004:0005:0006:0007:0008:0009:0010:0011:0012:0013:0014:0015:0016:0017:0018:0019:0020:0021:0022:0023:00
Humidity (%)878890919292928980726459555355587774908892949393

Atmospheric pressure

Pressure
Time00:0001:0002:0003:0004:0005:0006:0007:0008:0009:0010:0011:0012:0013:0014:0015:0016:0017:0018:0019:0020:0021:0022:0023:00
Pressure (mm Hg)760760759759759759759759759759759758758758758758758758758758758758758758

Ultraviolet index

UV Index
Time00:0001:0002:0003:0004:0005:0006:0007:0008:0009:0010:0011:0012:0013:0014:0015:0016:0017:0018:0019:0020:0021:0022:0023:00
UV Index00000000.312.24.26.47.68.483.93.62.61.70.60.2000

Air quality & pollen

Air quality
Time00:0001:0002:0003:0004:0005:0006:0007:0008:0009:0010:0011:0012:0013:0014:0015:0016:0017:0018:0019:0020:0021:0022:0023:00
PM2.5 (µg/m³)4.33.93.94.24.54.95.35.666.88.710.511.511.49.79.39.39.51010.611.912.413.514.3
PM10 (µg/m³)4.3444.24.64.95.35.76.16.88.810.711.711.6109.79.69.910.31112.312.713.814.6
Ozone (O₃) (µg/m³)103102102101101100979597109125139147153157159160158154148140127112100
NO₂ (µg/m³)10.59.58.68.17.87.78.18.89.18.57.56.55.54.43.83.53.64.6710.413.616.619.521.1
SO₂ (µg/m³)2.32.22.22.22.22.32.42.52.73.13.743.93.73.43.12.82.72.93.23.53.73.94
CO (µg/m³)167156146138132130135144152157161162157150145143144154186227249232195173

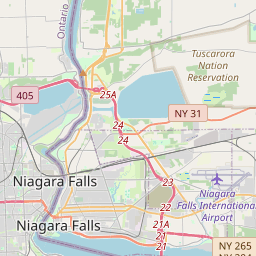
Niagara Falls on the map

Data Sources & Methodology

Our weather forecasts are powered by a professional weather data provider that aggregates data from national weather services, satellite observations, radar networks, and over 80,000 weather stations worldwide. Forecast data is updated multiple times daily. We convert raw data into clear summaries — wind speed in m/s, pressure in mmHg — so you can plan your day with confidence.