5-day weather forecast Naqadah Oct 27, 2026

33°22° · Dust storm

Weather forecast Naqadah Tuesday Oct 27, 2026: dust storm, temperature from 22 °C to 33 °C.

Precipitation probability 3%. Wind up to 6.11 m/s (gusts 11.11 m/s). Air humidity 17–54%, atmospheric pressure 758–761 mm Hg, UV index up to 7.1.

Sunrise 06:54
Sunset 18:11
Waning Gibbous94% illuminated
Moonrise 18:49 · Moonset 07:56
Chart
Table

Forecast from 22 °C to 33 °C and precipitation

Temperature & Precipitation
Time00:0001:0002:0003:0004:0005:0006:0007:0008:0009:0010:0011:0012:0013:0014:0015:0016:0017:0018:0019:0020:0021:0022:0023:00
Temperature (°C)272625242423222224252729313233333332312928282626
Precipitation (mm/hr)000000000000000000000000

Cloud cover and precipitation probability

Cloud cover & Rain chance
Time00:0001:0002:0003:0004:0005:0006:0007:0008:0009:0010:0011:0012:0013:0014:0015:0016:0017:0018:0019:0020:0021:0022:0023:00
Cloud cover (%)000000000100000425484203440
Rain chance (%)111222222110100101311211

Wind speed and direction

Wind & Wind gust
Time00:0001:0002:0003:0004:0005:0006:0007:0008:0009:0010:0011:0012:0013:0014:0015:0016:0017:0018:0019:0020:0021:0022:0023:00
Wind (m/s)3.113.113.1122.692.691.692.112.111.392.613.112.314.114.53.395.816.1145.614.813.53.393.31
Wind gust (m/s)6.814.3143.422.922.722.332.142.613.172.893.424.724.394.695.759.8111.117.149.58.726.474.693.89
Wind direction (°)NW 317°NW 306°WNW 292°WNW 295°WNW 295°WNW 301°WNW 293°WNW 293°WNW 289°WNW 295°WNW 291°WNW 292°WNW 290°WNW 287°WNW 285°WNW 289°WNW 290°WNW 294°WNW 302°WNW 298°NW 304°NW 305°WNW 300°WNW 298°

Air humidity

Humidity
Time00:0001:0002:0003:0004:0005:0006:0007:0008:0009:0010:0011:0012:0013:0014:0015:0016:0017:0018:0019:0020:0021:0022:0023:00
Humidity (%)434446504950545148453730351917261719282628303132

Atmospheric pressure

Pressure
Time00:0001:0002:0003:0004:0005:0006:0007:0008:0009:0010:0011:0012:0013:0014:0015:0016:0017:0018:0019:0020:0021:0022:0023:00
Pressure (mm Hg)759760759759759760760761761761761761761760759758758758758759760760761761

Ultraviolet index

UV Index
Time00:0001:0002:0003:0004:0005:0006:0007:0008:0009:0010:0011:0012:0013:0014:0015:0016:0017:0018:0019:0020:0021:0022:0023:00
UV Index000000000.21.22.956.57.16.24.32.20.8000000

Air quality & pollen

Air quality
Time00:0001:0002:0003:0004:0005:0006:0007:0008:0009:0010:0011:0012:0013:0014:0015:0016:0017:0018:0019:0020:0021:0022:0023:00
PM2.5 (µg/m³)8590.392.292.993.894.594.393.488.984.874.563.355.549.244.943.444.448.455.46478.99293.484.8
PM10 (µg/m³)344.6363.2359.5340.9320.4300.8283.1269.2230284.1275.7229.1199.3177.4162.5161.1171.8201.2244.9275.7351.1410.7406.1362.3
Ozone (O₃) (µg/m³)7269666255484341424862829710410710810910910710397918783
NO₂ (µg/m³)7.77.16.66.46.87.588.28.27.65.83.41.60.90.811.31.92.63.74.95.75.85.5
SO₂ (µg/m³)6.36.36.36.46.56.56.97.899.79.89.48.87.86.65.85.65.766.67.47.87.36.3
CO (µg/m³)156160163168178190200211220219199168145139140144150157161157149143142143

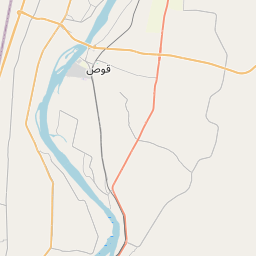
Naqadah on the map

Data Sources & Methodology

Our weather forecasts are powered by a professional weather data provider that aggregates data from national weather services, satellite observations, radar networks, and over 80,000 weather stations worldwide. Forecast data is updated multiple times daily. We convert raw data into clear summaries — wind speed in m/s, pressure in mmHg — so you can plan your day with confidence.