5-day weather forecast Ludhiana Nov 16, 2026

27°16° · Smoky haze

Weather forecast Ludhiana Monday Nov 16, 2026: smoky haze, temperature from 16 °C to 27 °C.

Precipitation probability 4%. Wind up to 3.5 m/s (gusts 5.94 m/s). Air humidity 26–65%, atmospheric pressure 759–762 mm Hg, UV index up to 3.8.

Sunrise 06:54
Sunset 17:28
First Quarter52% illuminated
Moonrise 12:40 · Moonset 23:39
Chart
Table

Forecast from 16 °C to 27 °C and precipitation

Temperature & Precipitation
Time00:0001:0002:0003:0004:0005:0006:0007:0008:0009:0010:0011:0012:0013:0014:0015:0016:0017:0018:0019:0020:0021:0022:0023:00
Temperature (°C)181717171616161718212325262727262422212019181717
Precipitation (mm/hr)000000000000000000000000

Cloud cover and precipitation probability

Cloud cover & Rain chance
Time00:0001:0002:0003:0004:0005:0006:0007:0008:0009:0010:0011:0012:0013:0014:0015:0016:0017:0018:0019:0020:0021:0022:0023:00
Cloud cover (%)000000000000000000000000
Rain chance (%)334444433211100011111222

Wind speed and direction

Wind & Wind gust
Time00:0001:0002:0003:0004:0005:0006:0007:0008:0009:0010:0011:0012:0013:0014:0015:0016:0017:0018:0019:0020:0021:0022:0023:00
Wind (m/s)1.691.691.691.811.691.611.51.611.691.8122.192.813.193.53.312.892.392.392.392.52.392.192.11
Wind gust (m/s)2.582.532.642.672.582.472.472.612.923.283.754.4255.445.945.4253.723.533.443.393.313.143
Wind direction (°)N 353°N 352°N 349°NNW 345°NNW 341°NNW 335°NW 322°NW 312°NW 308°NW 306°WNW 303°WNW 299°WNW 298°WNW 299°WNW 303°NW 307°NW 311°NW 315°NW 318°NW 319°NW 323°NNW 327°NNW 328°NW 326°

Air humidity

Humidity
Time00:0001:0002:0003:0004:0005:0006:0007:0008:0009:0010:0011:0012:0013:0014:0015:0016:0017:0018:0019:0020:0021:0022:0023:00
Humidity (%)586061636465636056484134312826293237404346495153

Atmospheric pressure

Pressure
Time00:0001:0002:0003:0004:0005:0006:0007:0008:0009:0010:0011:0012:0013:0014:0015:0016:0017:0018:0019:0020:0021:0022:0023:00
Pressure (mm Hg)761761761761761761761761762761761761761760759759759759759760760760760760

Ultraviolet index

UV Index
Time00:0001:0002:0003:0004:0005:0006:0007:0008:0009:0010:0011:0012:0013:0014:0015:0016:0017:0018:0019:0020:0021:0022:0023:00
UV Index000000000.51.32.53.53.83.42.41.20.40000000

Air quality & pollen

Air quality
Time00:0001:0002:0003:0004:0005:0006:0007:0008:0009:0010:0011:0012:0013:0014:0015:0016:0017:0018:0019:0020:0021:0022:0023:00
PM2.5 (µg/m³)57.459.360.861.260.860.362.467.368.75945.830.727.526.424.7242529.234.238.943.247.852.555.2
PM10 (µg/m³)61.963.865.465.965.765.267.372.271.964.35238.835.332.93028.32831.53640.344.549.153.756.3
Ozone (O₃) (µg/m³)4843383636353026315589116128132132126115104938171635751
NO₂ (µg/m³)22.723.724.324.123.523.224.125.324.31911.45.62.91.92.65.49.814.218.222.125.227.328.629.3
SO₂ (µg/m³)8.17.97.87.77.67.78.39.19.59.38.88.175.85.15.35.96.87.89.110.110.811.311.6
CO (µg/m³)466469469450429454587766859784622483395330311369474559597615629645657664

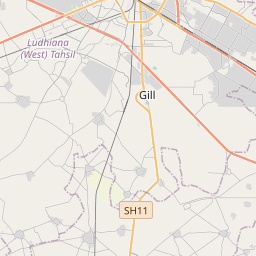
Ludhiana on the map

Data Sources & Methodology

Our weather forecasts are powered by a professional weather data provider that aggregates data from national weather services, satellite observations, radar networks, and over 80,000 weather stations worldwide. Forecast data is updated multiple times daily. We convert raw data into clear summaries — wind speed in m/s, pressure in mmHg — so you can plan your day with confidence.