5-day weather forecast Ludhiana Nov 15, 2026

27°18° · Smoky haze

Weather forecast Ludhiana tomorrow Nov 15, 2026: smoky haze, temperature from 18 °C to 27 °C.

Precipitation probability 53%. Wind up to 2.19 m/s (gusts 7.78 m/s). Air humidity 33–69%, atmospheric pressure 760–761 mm Hg, UV index up to 3.

Sunrise 06:53
Sunset 17:28
First Quarter42% illuminated
Moonrise 12:08 · Moonset 22:43
Chart
Table

Forecast from 18 °C to 27 °C and precipitation

Temperature & Precipitation
Time00:0001:0002:0003:0004:0005:0006:0007:0008:0009:0010:0011:0012:0013:0014:0015:0016:0017:0018:0019:0020:0021:0022:0023:00
Temperature (°C)201919181818181819222426262727272523222120191918
Precipitation (mm/hr)00.030.020.290.570.870.570.28000.010.01000000000000

Cloud cover and precipitation probability

Cloud cover & Rain chance
Time00:0001:0002:0003:0004:0005:0006:0007:0008:0009:0010:0011:0012:0013:0014:0015:0016:0017:0018:0019:0020:0021:0022:0023:00
Cloud cover (%)208174505885755932327572011100000000
Rain chance (%)4131222365341257587111111122233

Wind speed and direction

Wind & Wind gust
Time00:0001:0002:0003:0004:0005:0006:0007:0008:0009:0010:0011:0012:0013:0014:0015:0016:0017:0018:0019:0020:0021:0022:0023:00
Wind (m/s)0.610.690.810.51.52.191.610.811.111.1910.690.811.3922.112.112.1122.112.192.1121.89
Wind gust (m/s)1.281.421.783.145.337.785.974.783.443.363.533.563.673.8943.643.472.832.832.783.143.112.942.69
Wind direction (°)NE 51°NNE 26°N 352°NNE 15°NE 39°NE 35°NNE 27°NNE 15°NNE 19°N 10°N 3°NNE 12°NW 310°WNW 300°WNW 298°NW 310°NW 321°NNW 338°NNW 344°NNW 347°NNW 347°NNW 348°N 351°N 354°

Air humidity

Humidity
Time00:0001:0002:0003:0004:0005:0006:0007:0008:0009:0010:0011:0012:0013:0014:0015:0016:0017:0018:0019:0020:0021:0022:0023:00
Humidity (%)575859656769686866574940383633363943464850525456

Atmospheric pressure

Pressure
Time00:0001:0002:0003:0004:0005:0006:0007:0008:0009:0010:0011:0012:0013:0014:0015:0016:0017:0018:0019:0020:0021:0022:0023:00
Pressure (mm Hg)761760760760760760761761761761761761761760760760760760760761761761761761

Ultraviolet index

UV Index
Time00:0001:0002:0003:0004:0005:0006:0007:0008:0009:0010:0011:0012:0013:0014:0015:0016:0017:0018:0019:0020:0021:0022:0023:00
UV Index000000000.31.12.12.832.82.21.20.40000000

Air quality & pollen

Air quality
Time00:0001:0002:0003:0004:0005:0006:0007:0008:0009:0010:0011:0012:0013:0014:0015:0016:0017:0018:0019:0020:0021:0022:0023:00
PM2.5 (µg/m³)108105.5102.294.874.345.639.349.950.64336.835.535.334.933.231.432.236.340.543.546.850.554.156.1
PM10 (µg/m³)118.7116.2113.4106.684.355.14858.257.551.947.647.347.346.343.139.738.34144.847.65154.858.460.5
Ozone (O₃) (µg/m³)005255270675552689311312413013012110793837466615854
NO₂ (µg/m³)64.96255.642.325.413.812.716.818.915.49.95.53.22.12.44.88.712.315.318.120.221.221.421.8
SO₂ (µg/m³)13.712.511.29.67.86.66.46.77.17.588.17.36.15.255.25.566.67.27.67.98.1
CO (µg/m³)737687621521406341380471517468375299258233234273338395437473494493479467

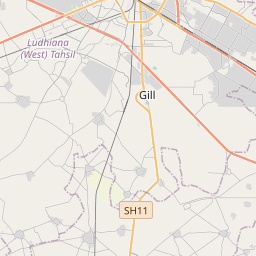
Ludhiana on the map

Data Sources & Methodology

Our weather forecasts are powered by a professional weather data provider that aggregates data from national weather services, satellite observations, radar networks, and over 80,000 weather stations worldwide. Forecast data is updated multiple times daily. We convert raw data into clear summaries — wind speed in m/s, pressure in mmHg — so you can plan your day with confidence.