5-day weather forecast Lisala Nov 18, 2026

28°23° · Patchy rain possible

Weather forecast Lisala Wednesday Nov 18, 2026: patchy rain possible, temperature from 23 °C to 28 °C.

Precipitation probability 43%. Wind up to 2 m/s (gusts 6.56 m/s). Air humidity 72–99%, atmospheric pressure 757–760 mm Hg, UV index up to 5.6.

Sunrise 05:18
Sunset 17:19
Waxing Gibbous73% illuminated
Moonrise 12:34 · Moonset 00:10
Chart
Table

Forecast from 23 °C to 28 °C and precipitation

Temperature & Precipitation
Time00:0001:0002:0003:0004:0005:0006:0007:0008:0009:0010:0011:0012:0013:0014:0015:0016:0017:0018:0019:0020:0021:0022:0023:00
Temperature (°C)232323232323232425262727282827272625242424232323
Precipitation (mm/hr)0000000.010.020.020.030.050.140.230.320.250.180.120.080.0400000

Cloud cover and precipitation probability

Cloud cover & Rain chance
Time00:0001:0002:0003:0004:0005:0006:0007:0008:0009:0010:0011:0012:0013:0014:0015:0016:0017:0018:0019:0020:0021:0022:0023:00
Cloud cover (%)10010010010010010096100999998959390939699999999987476100
Rain chance (%)434343434342393429262429323642423737343231313242

Wind speed and direction

Wind & Wind gust
Time00:0001:0002:0003:0004:0005:0006:0007:0008:0009:0010:0011:0012:0013:0014:0015:0016:0017:0018:0019:0020:0021:0022:0023:00
Wind (m/s)1.51.811.691.611.311.6121.811.51.811.691.611.611.6110.50.390.310.110.3100.310.50.61
Wind gust (m/s)4.255.255.425.034.365.56.566.315.314.974.754.444.144.033.583.312.612.361.861.331.221.030.861.5
Wind direction (°)SSW 213°SSW 211°SW 215°SW 225°SW 214°SSW 205°SSW 203°SSW 199°SSW 194°SSW 199°SSW 195°SSW 192°SSW 194°SSW 193°S 182°SSE 157°E 87°ESE 106°SW 225°NW 325°E 100°SSE 152°SE 144°SSE 166°

Air humidity

Humidity
Time00:0001:0002:0003:0004:0005:0006:0007:0008:0009:0010:0011:0012:0013:0014:0015:0016:0017:0018:0019:0020:0021:0022:0023:00
Humidity (%)999998989897959388817574727277818690929493949697

Atmospheric pressure

Pressure
Time00:0001:0002:0003:0004:0005:0006:0007:0008:0009:0010:0011:0012:0013:0014:0015:0016:0017:0018:0019:0020:0021:0022:0023:00
Pressure (mm Hg)758758758758758758759760760760760759758757757757757757758758758759759759

Ultraviolet index

UV Index
Time00:0001:0002:0003:0004:0005:0006:0007:0008:0009:0010:0011:0012:0013:0014:0015:0016:0017:0018:0019:0020:0021:0022:0023:00
UV Index00000000.20.71.93.24.75.6542.30.80.1000000

Air quality & pollen

Air quality
Time00:0001:0002:0003:0004:0005:0006:0007:0008:0009:0010:0011:0012:0013:0014:0015:0016:0017:0018:0019:0020:0021:0022:0023:00
PM2.5 (µg/m³)10.78.88.88.17.87.67.56.86.26.37.188.58.899.19.29.29.810.310.911.612.512.6
PM10 (µg/m³)11.49.39.18.487.87.776.46.57.48.499.39.69.79.99.710.410.911.512.113.113.2
Ozone (O₃) (µg/m³)323333323130303032353842464950494744413733292623
NO₂ (µg/m³)1.11.11.110.90.80.70.60.50.30.20.20.20.20.30.30.50.711.41.92.62.92.8
SO₂ (µg/m³)0.20.20.20.10.10.10.20.20.20.20.20.20.20.20.20.20.20.20.20.20.30.40.40.4
CO (µg/m³)252245234220208200195191189190190190190190189188195216244273302331352364

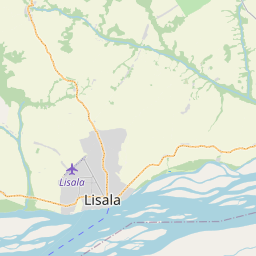
Lisala on the map

Data Sources & Methodology

Our weather forecasts are powered by a professional weather data provider that aggregates data from national weather services, satellite observations, radar networks, and over 80,000 weather stations worldwide. Forecast data is updated multiple times daily. We convert raw data into clear summaries — wind speed in m/s, pressure in mmHg — so you can plan your day with confidence.