5-day weather forecast Limbach-Oberfrohna Sep 8, 2026

26°18° · Overcast

Weather forecast Limbach-Oberfrohna Tuesday Sep 8, 2026: overcast, temperature from 18 °C to 26 °C.

Precipitation probability 26%. Wind up to 5.61 m/s (gusts 10.92 m/s). Air humidity 38–85%, atmospheric pressure 758–763 mm Hg, UV index up to 4.9.

Sunrise 06:33
Sunset 19:39
Waning Crescent6% illuminated
Moonrise 02:05 · Moonset 18:31
Chart
Table

Forecast from 18 °C to 26 °C and precipitation

Temperature & Precipitation
Time00:0001:0002:0003:0004:0005:0006:0007:0008:0009:0010:0011:0012:0013:0014:0015:0016:0017:0018:0019:0020:0021:0022:0023:00
Temperature (°C)202020191919191918192122242525262525252523222121
Precipitation (mm/hr)000000000000000000000000

Cloud cover and precipitation probability

Cloud cover & Rain chance
Time00:0001:0002:0003:0004:0005:0006:0007:0008:0009:0010:0011:0012:0013:0014:0015:0016:0017:0018:0019:0020:0021:0022:0023:00
Cloud cover (%)5030542659910010010076883335788197100100100100100969494
Rain chance (%)10971218262624201312437791010111315151717

Wind speed and direction

Wind & Wind gust
Time00:0001:0002:0003:0004:0005:0006:0007:0008:0009:0010:0011:0012:0013:0014:0015:0016:0017:0018:0019:0020:0021:0022:0023:00
Wind (m/s)2.692.813.313.393.393.613.693.614.194.814.8954.895.195.615.315.614.192.692.111.51.391.391.69
Wind gust (m/s)2.923.316.619.221010.9210.510.1910.1197.317.037.117.818.428.229.228.725.112.141.614.391.395.69
Wind direction (°)S 178°S 185°SSW 192°SSW 192°SSW 196°SSW 198°SW 217°SW 221°SW 226°SW 236°WSW 246°WSW 253°WSW 248°WSW 246°WSW 244°WSW 243°WSW 254°WSW 246°SW 234°SSW 210°SSW 205°SSW 203°SSW 203°WSW 257°

Air humidity

Humidity
Time00:0001:0002:0003:0004:0005:0006:0007:0008:0009:0010:0011:0012:0013:0014:0015:0016:0017:0018:0019:0020:0021:0022:0023:00
Humidity (%)707274788385848173676054464239383842495662656969

Atmospheric pressure

Pressure
Time00:0001:0002:0003:0004:0005:0006:0007:0008:0009:0010:0011:0012:0013:0014:0015:0016:0017:0018:0019:0020:0021:0022:0023:00
Pressure (mm Hg)763763763762762762762762762762761761761761760760759759758758758758758758

Ultraviolet index

UV Index
Time00:0001:0002:0003:0004:0005:0006:0007:0008:0009:0010:0011:0012:0013:0014:0015:0016:0017:0018:0019:0020:0021:0022:0023:00
UV Index000000000.412.13.44.44.94.63.72.51.20.400000

Air quality & pollen

Air quality
Time00:0001:0002:0003:0004:0005:0006:0007:0008:0009:0010:0011:0012:0013:0014:0015:0016:0017:0018:0019:0020:0021:0022:0023:00
PM2.5 (µg/m³)6.77.88.47.87.36.99.49.79.911.110.68.76.54.8444.44.35.466.26.77.27
PM10 (µg/m³)12.814.815.413.212.712.913.212.812.716.916.313.911.28.37.988.27.788.48.58.89.39.5
Ozone (O₃) (µg/m³)777576767267605451536368737773727170736867574945
NO₂ (µg/m³)43.53.33.13.43.14.15.77.45.73.82.721.822.53.23.84.86.18.68.898.4
SO₂ (µg/m³)0.80.80.80.70.80.80.90.911.210.80.60.60.50.50.60.50.50.60.70.80.80.8
CO (µg/m³)151143137132130132132136139142138128122119120124123129135139147150150148

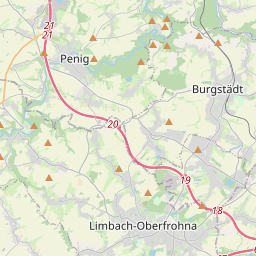
Limbach-Oberfrohna on the map

Data Sources & Methodology

Our weather forecasts are powered by a professional weather data provider that aggregates data from national weather services, satellite observations, radar networks, and over 80,000 weather stations worldwide. Forecast data is updated multiple times daily. We convert raw data into clear summaries — wind speed in m/s, pressure in mmHg — so you can plan your day with confidence.