5-day weather forecast Libenge Nov 22, 2026

34°23° · Patchy rain possible

Weather forecast Libenge Sunday Nov 22, 2026: patchy rain possible, temperature from 23 °C to 34 °C.

Precipitation probability 33%. Wind up to 2.39 m/s (gusts 6.17 m/s). Air humidity 47–92%, atmospheric pressure 754–759 mm Hg, UV index up to 9.7.

Sunrise 05:33
Sunset 17:29
Full Moon98% illuminated
Moonrise 15:31 · Moonset 03:14
Chart
Table

Forecast from 23 °C to 34 °C and precipitation

Temperature & Precipitation
Time00:0001:0002:0003:0004:0005:0006:0007:0008:0009:0010:0011:0012:0013:0014:0015:0016:0017:0018:0019:0020:0021:0022:0023:00
Temperature (°C)242323232323232527293132333434333230282727262625
Precipitation (mm/hr)00000000.010.010.010.010.010.010.010.010.0100000000.08

Cloud cover and precipitation probability

Cloud cover & Rain chance
Time00:0001:0002:0003:0004:0005:0006:0007:0008:0009:0010:0011:0012:0013:0014:0015:0016:0017:0018:0019:0020:0021:0022:0023:00
Cloud cover (%)88596563759798991001009993939393928286959797999999
Rain chance (%)26202222253030262118151311101011912151720212333

Wind speed and direction

Wind & Wind gust
Time00:0001:0002:0003:0004:0005:0006:0007:0008:0009:0010:0011:0012:0013:0014:0015:0016:0017:0018:0019:0020:0021:0022:0023:00
Wind (m/s)1.811.811.51.391.311.391.391.391.691.8121.811.310.810.310.190.190.811.52.392.392.1921.69
Wind gust (m/s)3.473.282.752.422.172.52.943.314.084.615.2254.895.064.724.253.753.193.424.976.175.784.784.11
Wind direction (°)SW 223°SW 231°SW 233°SW 222°SW 214°SSW 209°SSW 213°SW 225°SW 236°SW 234°SW 235°WSW 239°WSW 240°WSW 247°WSW 254°WSW 248°WSW 250°S 188°S 171°S 182°SSW 192°S 185°S 178°S 187°

Air humidity

Humidity
Time00:0001:0002:0003:0004:0005:0006:0007:0008:0009:0010:0011:0012:0013:0014:0015:0016:0017:0018:0019:0020:0021:0022:0023:00
Humidity (%)889091929292908476686256514748505158657075778083

Atmospheric pressure

Pressure
Time00:0001:0002:0003:0004:0005:0006:0007:0008:0009:0010:0011:0012:0013:0014:0015:0016:0017:0018:0019:0020:0021:0022:0023:00
Pressure (mm Hg)758757757757758758758759759759758758756755755754754755755756757758758758

Ultraviolet index

UV Index
Time00:0001:0002:0003:0004:0005:0006:0007:0008:0009:0010:0011:0012:0013:0014:0015:0016:0017:0018:0019:0020:0021:0022:0023:00
UV Index00000000.624.279.29.78.52.510.80.2000000

Air quality & pollen

Air quality
Time00:0001:0002:0003:0004:0005:0006:0007:0008:0009:0010:0011:0012:0013:0014:0015:0016:0017:0018:0019:0020:0021:0022:0023:00
PM2.5 (µg/m³)18.517.917.216.315.214.313.81414.514.615.316.41717.718.719.820.720.319.719.218.818.618.718.7
PM10 (µg/m³)19.318.717.917.115.81514.51515.615.916.918.82021.122.624.72624.722.821.420.720.220.220.3
Ozone (O₃) (µg/m³)272524232325283134384145495254555449413531282523
NO₂ (µg/m³)1.81.71.61.41.210.80.60.50.40.30.30.30.30.30.30.40.711.41.72.12.42.8
SO₂ (µg/m³)0.30.30.30.20.20.20.20.20.20.20.20.20.30.30.30.30.30.30.30.30.30.30.30.3
CO (µg/m³)182171166165164164166166165163161159157156155154157167180192200206209209

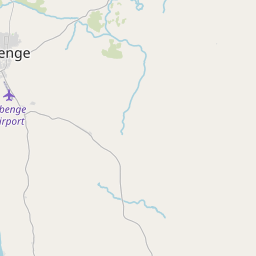
Libenge on the map

Data Sources & Methodology

Our weather forecasts are powered by a professional weather data provider that aggregates data from national weather services, satellite observations, radar networks, and over 80,000 weather stations worldwide. Forecast data is updated multiple times daily. We convert raw data into clear summaries — wind speed in m/s, pressure in mmHg — so you can plan your day with confidence.