5-day weather forecast Libenge Nov 21, 2026

35°23° · Overcast

Weather forecast Libenge tomorrow Nov 21, 2026: overcast, temperature from 23 °C to 35 °C.

Precipitation probability 27%. Wind up to 2.31 m/s (gusts 5.08 m/s). Air humidity 45–89%, atmospheric pressure 755–758 mm Hg, UV index up to 7.7.

Sunrise 05:33
Sunset 17:29
Waxing Gibbous95% illuminated
Moonrise 14:46 · Moonset 02:28
Chart
Table

Forecast from 23 °C to 35 °C and precipitation

Temperature & Precipitation
Time00:0001:0002:0003:0004:0005:0006:0007:0008:0009:0010:0011:0012:0013:0014:0015:0016:0017:0018:0019:0020:0021:0022:0023:00
Temperature (°C)242424242324242628303234353534333229272625252524
Precipitation (mm/hr)00.010000000000.010.010.020.050.090.090.060.0300000

Cloud cover and precipitation probability

Cloud cover & Rain chance
Time00:0001:0002:0003:0004:0005:0006:0007:0008:0009:0010:0011:0012:0013:0014:0015:0016:0017:0018:0019:0020:0021:0022:0023:00
Cloud cover (%)849694939292929392878556778176716575576795818571
Rain chance (%)232727272727262319141168917171717141723212321

Wind speed and direction

Wind & Wind gust
Time00:0001:0002:0003:0004:0005:0006:0007:0008:0009:0010:0011:0012:0013:0014:0015:0016:0017:0018:0019:0020:0021:0022:0023:00
Wind (m/s)1.51.611.51.391.3110.890.890.891.111.310.890.690.890.610.690.50.891.692.312.192.1921.89
Wind gust (m/s)2.222.532.472.422.172.082.192.472.643.033.313.474.335.084.174.333.693.7244.584.474.444.253.64
Wind direction (°)SW 218°SW 216°SW 228°SW 236°WSW 254°WSW 250°SW 236°SSW 212°SSW 200°SSW 201°SSW 208°SW 229°W 278°NW 312°NW 319°W 279°WSW 255°SSE 159°S 169°SSE 167°S 170°S 187°SSW 205°SW 216°

Air humidity

Humidity
Time00:0001:0002:0003:0004:0005:0006:0007:0008:0009:0010:0011:0012:0013:0014:0015:0016:0017:0018:0019:0020:0021:0022:0023:00
Humidity (%)868788898988878274675852484549555868748082838486

Atmospheric pressure

Pressure
Time00:0001:0002:0003:0004:0005:0006:0007:0008:0009:0010:0011:0012:0013:0014:0015:0016:0017:0018:0019:0020:0021:0022:0023:00
Pressure (mm Hg)758758758758758758758758758758758758757755755755755755756757758758758758

Ultraviolet index

UV Index
Time00:0001:0002:0003:0004:0005:0006:0007:0008:0009:0010:0011:0012:0013:0014:0015:0016:0017:0018:0019:0020:0021:0022:0023:00
UV Index00000000.51.73.35.86.57.77.24.52.710.2000000

Air quality & pollen

Air quality
Time00:0001:0002:0003:0004:0005:0006:0007:0008:0009:0010:0011:0012:0013:0014:0015:0016:0017:0018:0019:0020:0021:0022:0023:00
PM2.5 (µg/m³)20.519.919.619.218.618.218.318.318.518.919.419.619.719.219.119.420.321.122.221.320.52019.619.2
PM10 (µg/m³)22.221.521.220.720.119.619.719.920.321.121.922.522.922.522.823.524.624.325.223.722.121.220.620
Ozone (O₃) (µg/m³)313128252324273138475561677174747264534439353229
NO₂ (µg/m³)4.73.22.82.92.92.51.91.410.60.40.30.30.40.40.40.61.222.52.52.21.91.8
SO₂ (µg/m³)0.50.30.20.20.20.20.20.20.20.30.30.30.40.40.40.40.40.40.40.40.40.30.30.3
CO (µg/m³)192186180175172173175177177175173170166163161160164179198212215212206195

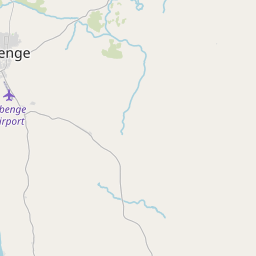
Libenge on the map

Data Sources & Methodology

Our weather forecasts are powered by a professional weather data provider that aggregates data from national weather services, satellite observations, radar networks, and over 80,000 weather stations worldwide. Forecast data is updated multiple times daily. We convert raw data into clear summaries — wind speed in m/s, pressure in mmHg — so you can plan your day with confidence.