5-day weather forecast Lahore 30-07-2026

Weather forecast Lahore Thursday, July 30 30.07.2026: sunny, temperature from 28 °C to 40 °C.

Precipitation probability 57%. Wind up to 8 m/s (gusts 10.67 m/s). Air humidity 35–81%, atmospheric pressure 744–748 mm Hg, UV index up to 6.4.

Sunrise 05:17
Sunset 19:00
Waning Gibbous96% illuminated
Moonrise 19:44 · Moonset 05:56
Chart
Table

Forecast from 28 °C to 40 °C and precipitation

Temperature & Precipitation
Time00:0001:0002:0003:0004:0005:0006:0007:0008:0009:0010:0011:0012:0013:0014:0015:0016:0017:0018:0019:0020:0021:0022:0023:00
Temperature (°C)333331313130303032333637373840404038373532312928
Precipitation (mm/hr)00.700.03000.020000000000001.820.33000

Cloud cover and precipitation probability

Cloud cover & Rain chance
Time00:0001:0002:0003:0004:0005:0006:0007:0008:0009:0010:0011:0012:0013:0014:0015:0016:0017:0018:0019:0020:0021:0022:0023:00
Cloud cover (%)237234802621821716131413111413183124188784213241
Rain chance (%)3375135614653221111222573671213

Wind speed and direction

Wind & Wind gust
Time00:0001:0002:0003:0004:0005:0006:0007:0008:0009:0010:0011:0012:0013:0014:0015:0016:0017:0018:0019:0020:0021:0022:0023:00
Wind (m/s)3.893.394.6144.614.394.115.115.895.614.894.393.893.393.54.315.56.196.316.115.617.6987
Wind gust (m/s)6.315.867.586.336.926.816.036.426.786.445.645.064.564.084.034.946.337.588.429.089.649.8610.678.86
Wind direction (°)SE 139°SE 127°SE 133°SE 137°SE 129°SE 131°SE 127°ESE 103°ESE 123°SE 137°SE 146°SSE 149°SSE 149°SE 139°SE 126°ESE 111°E 97°E 95°E 96°ESE 111°ESE 123°ESE 118°SE 126°SE 127°

Air humidity

Humidity
Time00:0001:0002:0003:0004:0005:0006:0007:0008:0009:0010:0011:0012:0013:0014:0015:0016:0017:0018:0019:0020:0021:0022:0023:00
Humidity (%)535560616366676863575045434238353842485360728181

Atmospheric pressure

Pressure
Time00:0001:0002:0003:0004:0005:0006:0007:0008:0009:0010:0011:0012:0013:0014:0015:0016:0017:0018:0019:0020:0021:0022:0023:00
Pressure (mm Hg)746746746746746746746746746747747747746746746745744744745746746746747748

Ultraviolet index

UV Index
Time00:0001:0002:0003:0004:0005:0006:0007:0008:0009:0010:0011:0012:0013:0014:0015:0016:0017:0018:0019:0020:0021:0022:0023:00
UV Index0000000.10.72.24.26.16.44.14.35.741.90.60.200000

Air quality & pollen

Air quality
Time00:0001:0002:0003:0004:0005:0006:0007:0008:0009:0010:0011:0012:0013:0014:0015:0016:0017:0018:0019:0020:0021:0022:0023:00
PM2.5 (µg/m³)42.840.939.334.229.522.517.914.715.716.52020.719.718.62121.631.424.624.926.928.831.434.938.1
PM10 (µg/m³)43.541.44035.230.523.218.31515.917.121.321.920.819.722.623.234.126.526.427.629.131.735.238.2
Ozone (O₃) (µg/m³)516375869710510810911212013214315516817617817616514010682757779
NO₂ (µg/m³)53.139.728.520.514.711.613.117.319.818.315.112.19.87.777.89.813.520.629.43534.831.428
SO₂ (µg/m³)13.411.49.78.26.96.47.3910.511.512.312.712.411.611.211.712.61312.211109.79.89.9
CO (µg/m³)79466757150146446754366173471464859856755159675296911401233128012651155984837

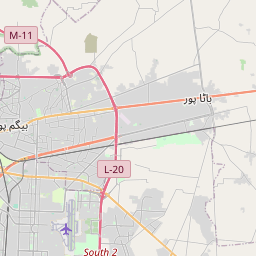
Lahore on the map

Data Sources & Methodology

Our weather forecasts are powered by a professional weather data provider that aggregates data from national weather services, satellite observations, radar networks, and over 80,000 weather stations worldwide. Forecast data is updated multiple times daily. We convert raw data into clear summaries — wind speed in m/s, pressure in mmHg — so you can plan your day with confidence.